Community Tip - When posting, your subject should be specific and summarize your question. Here are some additional tips on asking a great question. X
- Subscribe to RSS Feed
- Mark Topic as New
- Mark Topic as Read
- Float this Topic for Current User
- Bookmark
- Subscribe
- Mute
- Printer Friendly Page
Monte Carlo Simulation of the Streeter Phelps Equation
- Mark as New
- Bookmark
- Subscribe
- Mute
- Subscribe to RSS Feed
- Permalink
- Notify Moderator
Monte Carlo Simulation of the Streeter Phelps Equation
By D.M. Griffin, Jr.

- Uses the basic Streeter Phelps equation to calculate the dissolved oxygen deficit in a river or stream moving at a particular distance downstream
- Applicable in environmental engineering
- Performs using Monte Carlo simulation, Streeter Phelps Equation, reaeration constant, deoxygenation constant, statistical distribution, lognormal distribution, log mean, log SD, plot, histogram, normal distribution, mean deficit, deficit variation, standard deviation, etc
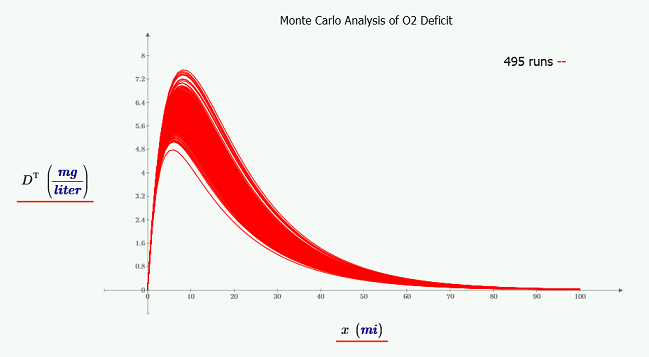
This worksheet using PTC Mathcad provides you with the basic Streeter Phelps equation which allows for the calculation of the dissolved oxygen deficit in a stream or river as a function of the distance downstream. The result is a function of the two kinetic constants, reaeration constant and the deoxygenation constant. After these values are calculated you can plot each "run" on the same set of axes.
It can be argued that a distribution of plots more accurately represents the real world. Next, the worksheet solves how the resulting deficits are distributed for a specific downstream distance. You can answer this by extracting the deficit computed for each run at the specific distance and plotting the values as a histogram.
The worksheet calculates this with mile 40 of the data provided. After you've evaluated whether the 0₂ deficit at any specific distance downstream is about normally distributed, you can compute the mean deficit at each downstream distance. You can also find the standard deviation and the mean plus/minus 3SD which provides the range over which 95% of computed deficits should fall.
All data, formulas, equations, solutions, plots, histograms, and notation are included to aid you in your own calculations.
Download and explore this worksheet yourself! You can download a free lifetime copy of PTC Mathcad Express and get 30 days of full functionality.
- Labels:
-
Statistics_Analysis


