
Turn on suggestions
Auto-suggest helps you quickly narrow down your search results by suggesting possible matches as you type.
Showing results for
Please log in to access translation
Turn on suggestions
Auto-suggest helps you quickly narrow down your search results by suggesting possible matches as you type.
Showing results for
Community Tip - Need to share some code when posting a question or reply? Make sure to use the "Insert code sample" menu option. Learn more! X
Translate the entire conversation x
Please log in to access translation
Options
- Subscribe to RSS Feed
- Mark Topic as New
- Mark Topic as Read
- Float this Topic for Current User
- Bookmark
- Subscribe
- Mute
- Printer Friendly Page
spherical plots.
Jan 17, 2013
03:17 PM
- Mark as New
- Bookmark
- Subscribe
- Mute
- Subscribe to RSS Feed
- Permalink
- Notify Moderator
Please log in to access translation
Jan 17, 2013
03:17 PM
spherical plots.
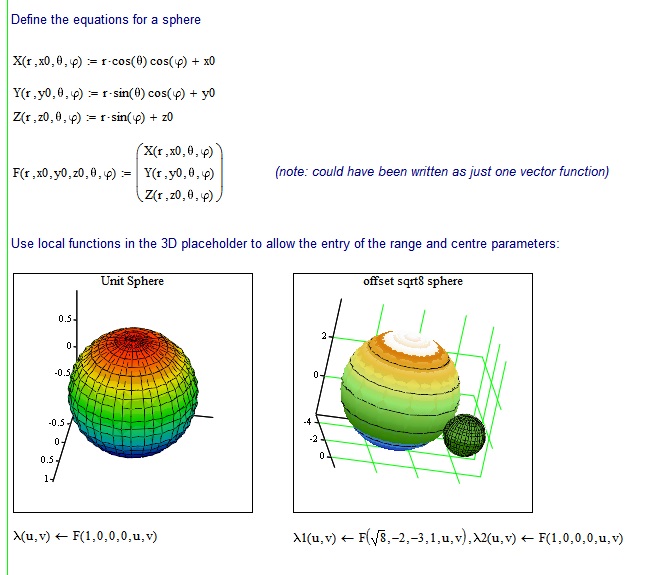
I would like to plot a sphere with xyz coordinates (-2,3,-1) for the center and a radius of the square root of 8. Without using create mesh or fitmap or anything else. Just define a F(x,y) and plot F.
Solved! Go to Solution.
Labels:
- Labels:
-
Algebra_Geometry
- Tags:
- xyz
ACCEPTED SOLUTION
Accepted Solutions
Jan 19, 2013
09:09 PM
- Mark as New
- Bookmark
- Subscribe
- Mute
- Subscribe to RSS Feed
- Permalink
- Notify Moderator
Please log in to access translation
13 REPLIES 13
Jan 17, 2013
03:22 PM
- Mark as New
- Bookmark
- Subscribe
- Mute
- Subscribe to RSS Feed
- Permalink
- Notify Moderator
Please log in to access translation
Jan 17, 2013
03:22 PM
Let us know how you fare!
Jan 17, 2013
03:33 PM
- Mark as New
- Bookmark
- Subscribe
- Mute
- Subscribe to RSS Feed
- Permalink
- Notify Moderator
Please log in to access translation
Jan 17, 2013
03:33 PM
I will certainly do that. A unit sphere is available in the resource center that only defines three functions X Y and Z. And then in the box on the chart simply enter X,Y,Z.
Jan 17, 2013
05:00 PM
- Mark as New
- Bookmark
- Subscribe
- Mute
- Subscribe to RSS Feed
- Permalink
- Notify Moderator
Please log in to access translation
Jan 17, 2013
05:00 PM
roger wells wrote:
I would like to plot a sphere with xyz coordinates (-2,3,-1) for the center and a radius of the square root of 8. Without using create mesh or fitmap or anything else. Just define a F(x,y) and plot F.
Like the attached?
Jan 18, 2013
11:05 AM
- Mark as New
- Bookmark
- Subscribe
- Mute
- Subscribe to RSS Feed
- Permalink
- Notify Moderator
Please log in to access translation
Jan 18, 2013
11:05 AM
Thanks for your help many times before, but unfortunately I do not have internet access. If you have plotted such a sphere you would need to post it here in a way it can be viewed on a computer that does not have the mathcad program. I find CreateMesh and fitmap difficult to use. I have plotted a half sphere (well actually a sphere would sit nicely into the shape created) just accidently by creating a matrix of points. Fred has also been of regular help and he is probably somewhat amused at my struggle to master this subject matter. Once I get that first sphere to show up and exactly match the one in my multivariable Calculus book, the light goes on . . .and suddenly I see whats going on . . .
Jan 18, 2013
11:22 AM
- Mark as New
- Bookmark
- Subscribe
- Mute
- Subscribe to RSS Feed
- Permalink
- Notify Moderator
Please log in to access translation
Jan 18, 2013
11:22 AM
Jan 18, 2013
11:32 AM
- Mark as New
- Bookmark
- Subscribe
- Mute
- Subscribe to RSS Feed
- Permalink
- Notify Moderator
Please log in to access translation
Jan 18, 2013
11:32 AM
Thankyou again. I will go home and try this.
Jan 18, 2013
05:28 PM
- Mark as New
- Bookmark
- Subscribe
- Mute
- Subscribe to RSS Feed
- Permalink
- Notify Moderator
Please log in to access translation
Jan 18, 2013
05:28 PM
well this has not worked. The three definations of X,Y,Z for the unit sphere are first year calculus. The next step you define a new function F as a one column three row matrix. The elements in that 1 X 3 matrix are the X,Y,Z functions defined in step one. Then to plot the sphere . . .another function (lambda (greek)) which itself is a function of two new variables u and v. The left arrow I assume is the local defination from the programming toolbar. This tells mathcad to plot this new function of (u,v) but assign the values 1 (for r the radius), three zero's (the origin of the unit sphere) and then . . .somehow . . .replace "theta" and "rho" the angles used in the previous definations with the new variables u and v . . .which appear to me to come out of nowhere. It just seems like alot of redundant code to do something that I can do so easily on a hand held graphing calculator.
Any way all of the code (although I can barely follow the syntax) is correctly entered into my wok sheet and still no sphere. There are no red numbers letters or error messages.
I am using mathcad 2000. and I am also unsure about your use of x0,y0,z0as ordinates. Have not seen this before. Am I possibly confusing this with x subscript 0, ysub 0, and zsub 0?
Jan 19, 2013
05:17 AM
- Mark as New
- Bookmark
- Subscribe
- Mute
- Subscribe to RSS Feed
- Permalink
- Notify Moderator
Please log in to access translation
Jan 19, 2013
05:17 AM
Stuarts has provided a step by step appraoch for clarity and there is no redundancy whatsoever. You may just write a single vector function if you like, as Stuarts has pointed out in his note. As of the "variables coming out from nowhere" - these are parameters of the functions involved and you may name them at your will and you don't have to use different names for phi/theta and u/v respectively if you feel more comfortable that way. The same goes for x0, y0, z0 - the names Stuart had chosen for the coordinates of the center of the sphere. As these are not independend variables I would not name them x,y,z, but you can do so, if you wish. BTW, in x0 there is no subscript, the 0 is simply part of the name and should show that its a specific value, not an independend variable. Call it center_x if you like.
As of the local assignment (I wouldn't had been able to come up with that idea) - it enables you to change the parameters (radius and centre) directly in the graph. You may do without and assign the normal way outside and above the graph.
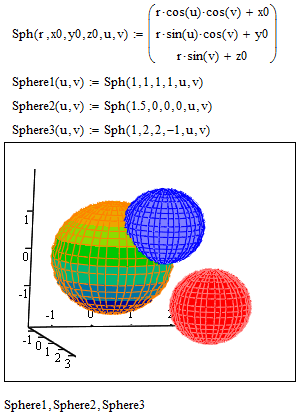
As its not working for you I'd guess that either there is a typo you did not spot or rather simply a difference between Mathcad 2000 and Mathcad 15. You cannot expect a twelve year old software to do the same in every respect as the current release. In case that the local assignment is doing bad, you may try it without as in the following.
Jan 19, 2013
06:14 AM
- Mark as New
- Bookmark
- Subscribe
- Mute
- Subscribe to RSS Feed
- Permalink
- Notify Moderator
Please log in to access translation
Jan 19, 2013
06:14 AM
roger wells wrote:
well this has not worked. The three definations of X,Y,Z for the unit sphere are first year calculus. The next step you define a new function F as a one column three row matrix. The elements in that 1 X 3 matrix are the X,Y,Z functions defined in step one. Then to plot the sphere . . .another function (lambda (greek)) which itself is a function of two new variables u and v. The left arrow I assume is the local defination from the programming toolbar. This tells mathcad to plot this new function of (u,v) but assign the values 1 (for r the radius), three zero's (the origin of the unit sphere) and then . . .somehow . . .replace "theta" and "rho" the angles used in the previous definations with the new variables u and v . . .which appear to me to come out of nowhere. It just seems like alot of redundant code to do something that I can do so easily on a hand held graphing calculator.
Any way all of the code (although I can barely follow the syntax) is correctly entered into my wok sheet and still no sphere. There are no red numbers letters or error messages.
I am using mathcad 2000. and I am also unsure about your use of x0,y0,z0as ordinates. Have not seen this before. Am I possibly confusing this with x subscript 0, ysub 0, and zsub 0?
See Werner's reply. In particular, M12 onwards introduced the concept of a local functions, whereby you can define a 'subfunction' within a function. Mathcad 2000 doesn't have this capability but Werner's solution should work in M2000 - it certainly works in M11.
Here's another example ... that first image was nagging at something in the back of my mind. 
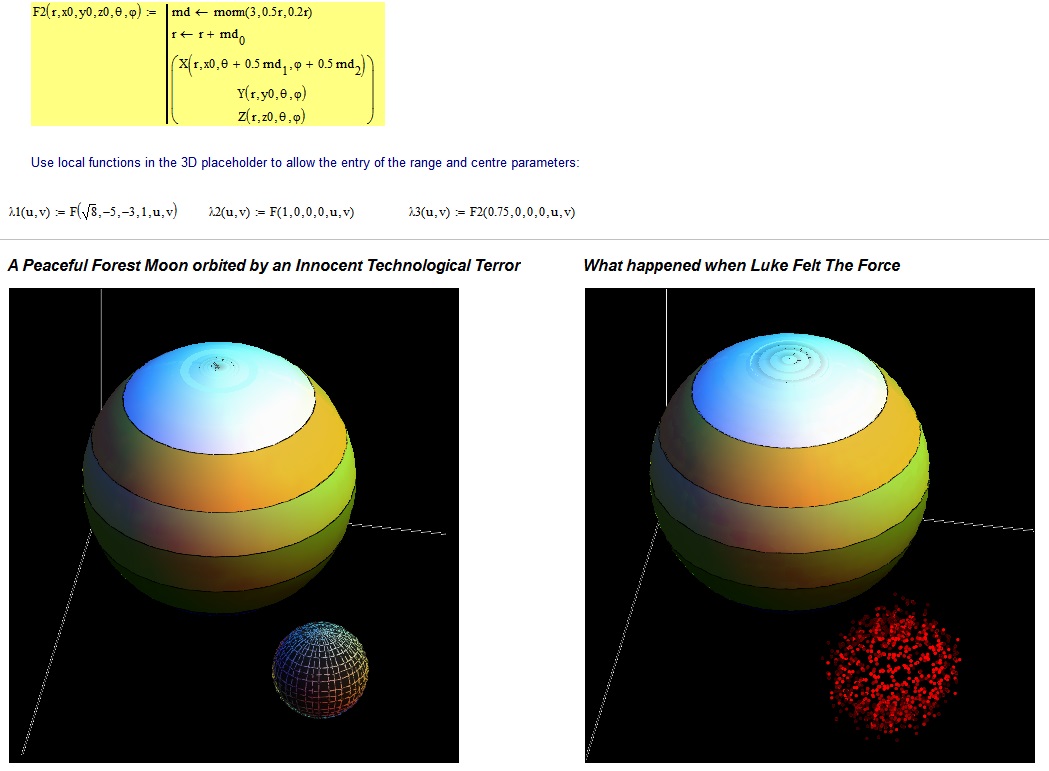
I plotted the second sphere as Data Points to get the effect. It's a shame that one can't select the colour map independently for each plot.
Stuart
Jan 19, 2013
12:38 PM
- Mark as New
- Bookmark
- Subscribe
- Mute
- Subscribe to RSS Feed
- Permalink
- Notify Moderator
Please log in to access translation
Jan 19, 2013
12:38 PM
Thankyou to all for your help on this. I am closing in fast and will eventualy plot 3D objects like pyramids,spheres and planes, intersecting in space. This of course (although not nearly as fantastic as your "when luke felt the force") will be a personal best in my mathematical endeavors.
Jan 19, 2013
09:09 PM
- Mark as New
- Bookmark
- Subscribe
- Mute
- Subscribe to RSS Feed
- Permalink
- Notify Moderator
Please log in to access translation
Jan 19, 2013
09:09 PM
So at last you got it to work for you?
Jan 22, 2013
11:08 AM
- Mark as New
- Bookmark
- Subscribe
- Mute
- Subscribe to RSS Feed
- Permalink
- Notify Moderator
Please log in to access translation
Jan 22, 2013
11:08 AM
Yes, I was able to plot all three of the figures in your example posted on 19 jan. And I can see that definations I thought "came out of nowhere", strictly; I could not understand XYZ then becoming F(r,x,y,z,theta,rho) and then finaly turning into lambda(u,v), in Stuarts example. I still dont quite follow how those last two elements in parentheses u and v seperated by a coma gat asigned to the function lambda. How does the machine know where u and v came from and more importantly, how do you people ever get to the level where you can keep track of so many things going on.
But any way by just copying your exemple, I can plot any sphere of any dimension just by changing the xyz, or more strictly (and I see it maters not) x0,y0,z0.
thanks again to all
Jan 22, 2013
11:45 AM
- Mark as New
- Bookmark
- Subscribe
- Mute
- Subscribe to RSS Feed
- Permalink
- Notify Moderator
Please log in to access translation
Jan 22, 2013
11:45 AM
Seems to be a problem with the difference between formal and actual parameter.
If you define a function f(x):=sin(x), x is called the formal parameter. Set b:=pi/6 and invoke f with b as parameter, then b would be called the actual parameter, would pass it to sine-function which returns 0.5 to f which itself returns that value to the invoking instance. The point is that a must not be named x for the whole thing to work. If a function is invoked with an actual parameter, the formal parameter is replaced and evaluated with the actual parameter in all occurencies.
Maybe its easier to look at that chain of functions from the other end.
What happens when lambda is invoked with the two parameters u and v? lambda is written so that it passes these parameters as the last two parameters of function F. The first four parameters of F are fixed values representig radius and center. The function F is written in such a manner that the last two formal parameters are named theta and phi, so theta gets the value u and phi the value v and F invokes the three functions X, Y, Z with some of its 6 parameters, couples the results of these three functions in a vector and returns it to lamba. There could have been even more different parameter names. The whole thing would work with X(R,a,i,j):=a*cos(i)........ etc. as well.
BTW, I would think that Stuart should get the honour of having solved the question, I just cleaned up a bit.


