Community Tip - Want the oppurtunity to discuss enhancements to PTC products? Join a working group! X
- Subscribe to RSS Feed
- Mark Topic as New
- Mark Topic as Read
- Float this Topic for Current User
- Bookmark
- Subscribe
- Mute
- Printer Friendly Page
Creation a plot with error bars (Y and X axis)
- Mark as New
- Bookmark
- Subscribe
- Mute
- Subscribe to RSS Feed
- Permalink
- Notify Moderator
Creation a plot with error bars (Y and X axis)
Hello, Dear Mathcad users!
It's my first lessons on mathcad prime 2.0, and I'am trying to create a plot with error bars (Y and X axis).
I managed with Y-axis, but I cannot make the same on X-axis.
Could somebody help me how to do it?
The file I've created attached.
Andrey KIselev
Student of Moscow State University.
Solved! Go to Solution.
- Labels:
-
Other
Accepted Solutions
- Mark as New
- Bookmark
- Subscribe
- Mute
- Subscribe to RSS Feed
- Permalink
- Notify Moderator
This was possible in Mathcad 15 (see the attached worksheet), but it no longer works in Prime due to a serious limitation in the graphing. Until they fix this, I can't think of any realistic way to do it.
- Mark as New
- Bookmark
- Subscribe
- Mute
- Subscribe to RSS Feed
- Permalink
- Notify Moderator
Thank you, Mr. Jackson.
It's a pity that the latest version of Mathcad can't manage with some old tasks.
But, nevertheless, you was wery helpfull.
Best reguards, Andrey.
- Mark as New
- Bookmark
- Subscribe
- Mute
- Subscribe to RSS Feed
- Permalink
- Notify Moderator
Hi Richard/All,
Does anyone know if this has been fixed in Mathcad Prime 2.0 yet?
I am planning to have my students use Mathcad to do their physics lab write-ups and error bars (both x and y) would be really useful!
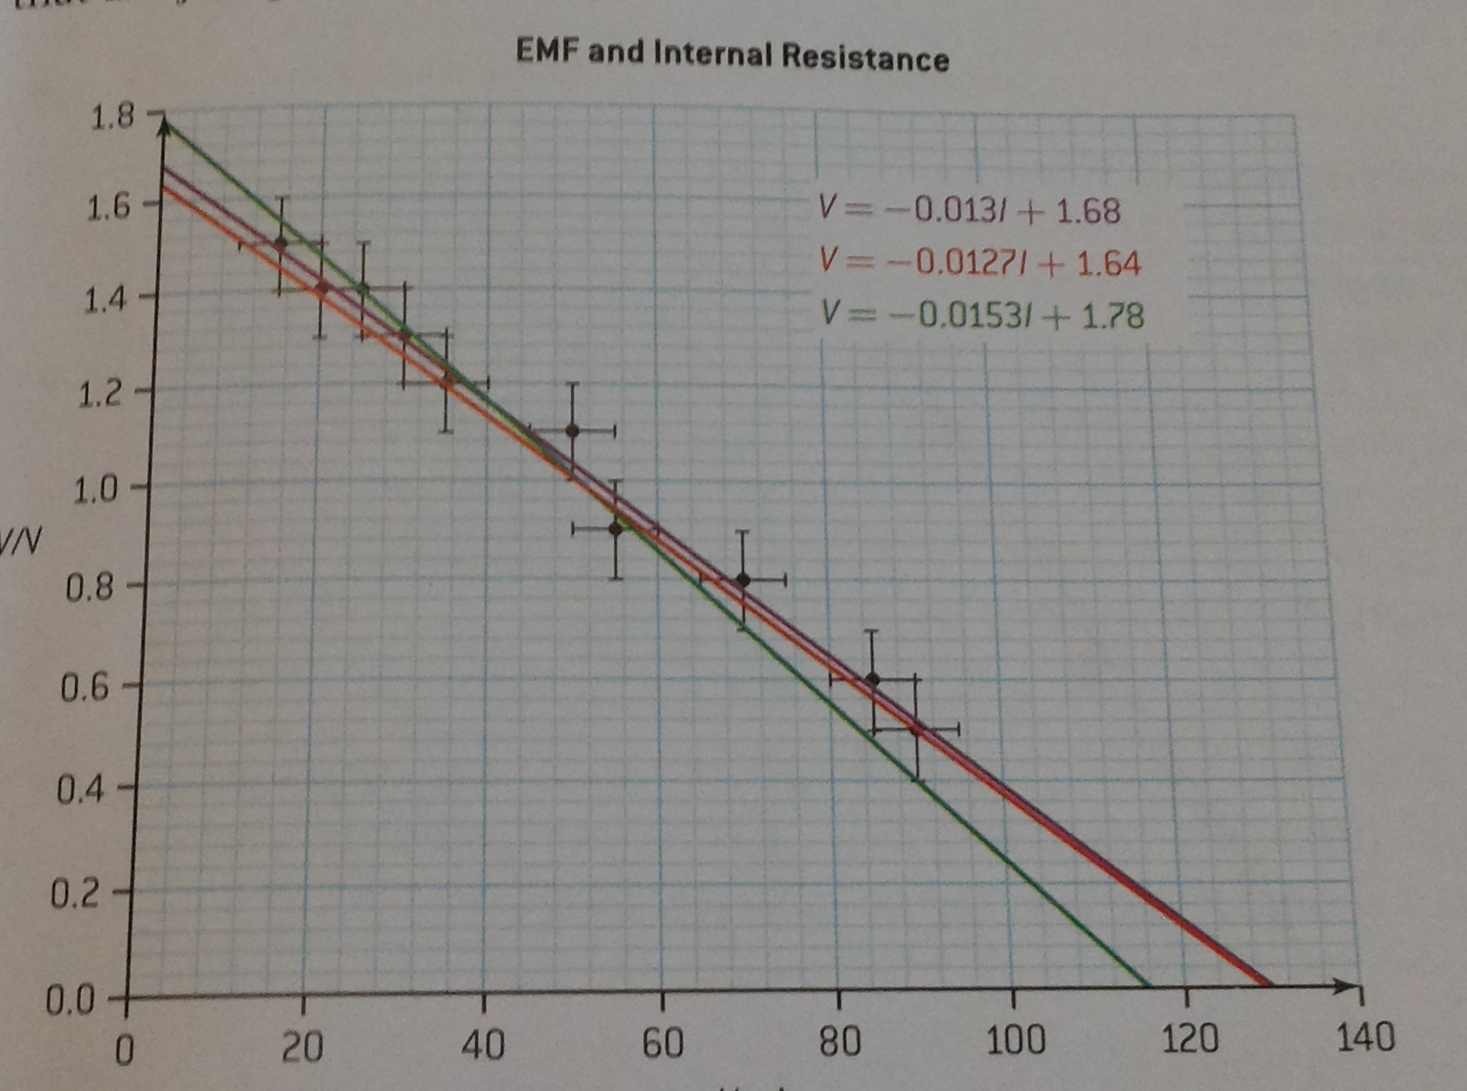
Also does anyone know how to do the maximum and minimum slopes of the lines of best fit that pass through all the error bar lines (for example, see attached picture)?
Thanks,
Benson
- Mark as New
- Bookmark
- Subscribe
- Mute
- Subscribe to RSS Feed
- Permalink
- Notify Moderator
ps - anyone got any ideas on how to represent/deal with uncertainties in measured values that you put into a data table using the "insert table" feature?
- Mark as New
- Bookmark
- Subscribe
- Mute
- Subscribe to RSS Feed
- Permalink
- Notify Moderator
Does anyone know if this has been fixed in Mathcad Prime 2.0 yet?
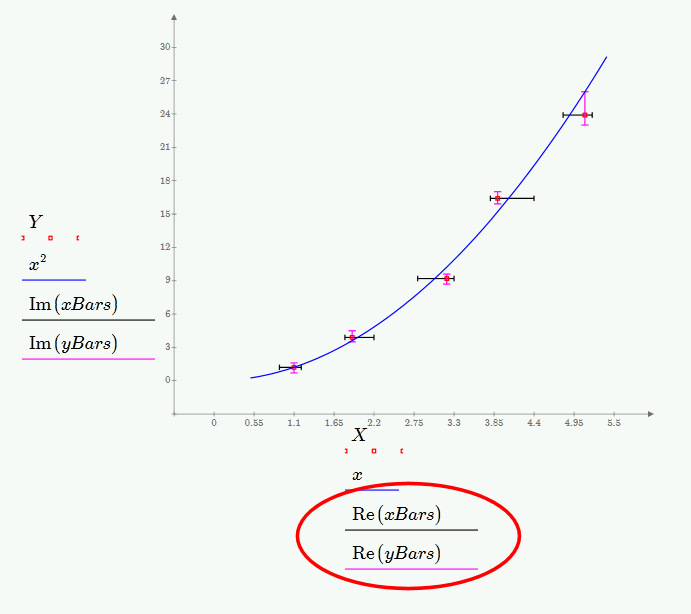
The x and y error bars can actually be made to work in Prime. Put the cursor in Re(xBars) on the graph axis and change the plot type to waterfall trace. Then do the same for Re(yBars).
- Mark as New
- Bookmark
- Subscribe
- Mute
- Subscribe to RSS Feed
- Permalink
- Notify Moderator
Also does anyone know how to do the maximum and minimum slopes of the lines of best fit that pass through all the error bar lines (for example, see attached picture)?
Here are worksheets that show how to fit a line to data with errors in both x and y (there is no built-in Mathcad function to do it) and how to calculate the errors in the fitted parameters (this worksheet was taken from the Data Analysis Extension Pack in MC15). Unfortunately, the error calculation assumes errors in y only, and I don't have a worksheet that shows how to do these calculations when there are errors in both x and y. The Mathcad Prime files are for Prime 3.0 (sorry, I have no way to convert to Prime 2.0 format). The Data Analysis Extension Pack didn't convert perfectly, but it could be fixed.
- Mark as New
- Bookmark
- Subscribe
- Mute
- Subscribe to RSS Feed
- Permalink
- Notify Moderator
Hi Richard,
Thanks so much for responding!
Just a few follow-up questions though:
-what do you mean by "Re(xBars)" and "Re(yBars)"?
-the academic version I get as part of the PTC Schools programe is Prime 2.0. Is it possible for you to post .XPS file exports or screenshots so I can see what method you used?
-finally, any idea how to put the +/- uncertainty into a table of values created by using the "insert table" feature? Because the format seems to be fixed as <variable1> <units1> , <variable2> <units2> etc, so you can put x (s) and y (m) but not x (+/- 0.1s) and y (+/- 0.01m) for example. I guess worst case you could add separate columns for the upper and lower uncertainty bounds, right?
Cheers,
Benson
- Mark as New
- Bookmark
- Subscribe
- Mute
- Subscribe to RSS Feed
- Permalink
- Notify Moderator
-what do you mean by "Re(xBars)" and "Re(yBars)"?
That's actually very obvious if you look in the worksheets.
-the academic version I get as part of the PTC Schools programe is Prime 2.0. Is it possible for you to post .XPS file exports or screenshots so I can see what method you used?
Your Prime 2.0 license file will work for Mathcad 15, which you can get here: http://www.ptc.com/product/mathcad/free-trial/thank-you. If you have Mathcad 15 installed you will also have a converter installed that will convert the Mathcad 15 files to Prime 2.0 files (although you will have to do a couple of fixes after the conversion).
I guess worst case you could add separate columns for the upper and lower uncertainty bounds, right?
That's the only way I can think of.
- Mark as New
- Bookmark
- Subscribe
- Mute
- Subscribe to RSS Feed
- Permalink
- Notify Moderator
Hi Richard,
Thanks again for the clarification.
I've now upgraded to Mathcad Prime 3.0 and opened the files that you attached, but there does seem to be quite a few problems with the formatting, and I can't find a reference to Re(xBars) or Re(yBars) anywhere. Moreover, the statistical methods used in those sheets are far too complicated for what we need to do in IB DP Physics.
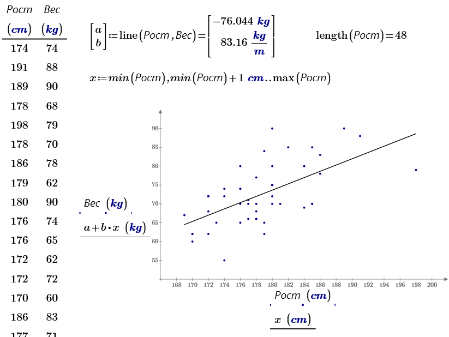
Basically, all I need is a simple example, showing how data with uncertainties could be put into a table and then plotted with error bars and max and min slope lines of best fit. In other words, something just like the below example, but augmented to include uncertainty data, error bars in x and y and max and min slope lines of best fit (and with slightly less scatter in the data, of course!).
Do you (or does anybody out there) have something like that you could share?
Thanks!
Benson
- Mark as New
- Bookmark
- Subscribe
- Mute
- Subscribe to RSS Feed
- Permalink
- Notify Moderator
- Mark as New
- Bookmark
- Subscribe
- Mute
- Subscribe to RSS Feed
- Permalink
- Notify Moderator
Benson Wallace wrote:
Hi Richard,
Thanks again for the clarification.
I've now upgraded to Mathcad Prime 3.0 and opened the files that you attached, but there does seem to be quite a few problems with the formatting, and I can't find a reference to Re(xBars) or Re(yBars) anywhere.
The converter usually does a very bad job in converting older files and you are lucky if they work at all after conversion - formatting being the minor problem. When you buy Prime you are entitled using Mathcad 15 as well - they share the same license file. So why not install MC15, which is the more powerful and less cumbersome version anyway, and look at the files as they were created and intended originally.
I guess you can find the references you are looking for if you scroll further to the right.
BTW, what algorithm is used to calculate the min and max slope (and intercept) of all possible regression lines?
- Mark as New
- Bookmark
- Subscribe
- Mute
- Subscribe to RSS Feed
- Permalink
- Notify Moderator
I can't find a reference to Re(xBars) or Re(yBars) anywhere.

Moreover, the statistical methods used in those sheets are far too complicated for what we need to do in IB DP Physics.
Basically, all I need is a simple example, showing how data with uncertainties could be put into a table and then plotted with error bars and max and min slope lines of best fit. In other words, something just like the below example, but augmented to include uncertainty data, error bars in x and y and max and min slope lines of best fit (and with slightly less scatter in the data, of course!).
The only way to calculate the min and max slope is to calculate the best fit slope and the uncertainty in the slope. How to calculate that uncertainty is shown in one of the worksheets. The uncertainty is a standard deviation, so to within 99% confidence the max and min slopes are best fit slope +/- 3 x uncertainty.


