
Turn on suggestions
Auto-suggest helps you quickly narrow down your search results by suggesting possible matches as you type.
Showing results for
Please log in to access translation
Turn on suggestions
Auto-suggest helps you quickly narrow down your search results by suggesting possible matches as you type.
Showing results for
Community Tip - You can change your system assigned username to something more personal in your community settings. X
- Community
- Creo+ and Creo Parametric
- 3D Part & Assembly Design
- Re: Working with geometry of parts.
Translate the entire conversation x
Please log in to access translation
Options
- Subscribe to RSS Feed
- Mark Topic as New
- Mark Topic as Read
- Float this Topic for Current User
- Bookmark
- Subscribe
- Mute
- Printer Friendly Page
Working with geometry of parts.
Jul 11, 2011
08:02 AM
- Mark as New
- Bookmark
- Subscribe
- Mute
- Subscribe to RSS Feed
- Permalink
- Notify Moderator
Please log in to access translation
Jul 11, 2011
08:02 AM
Working with geometry of parts.
Hello!
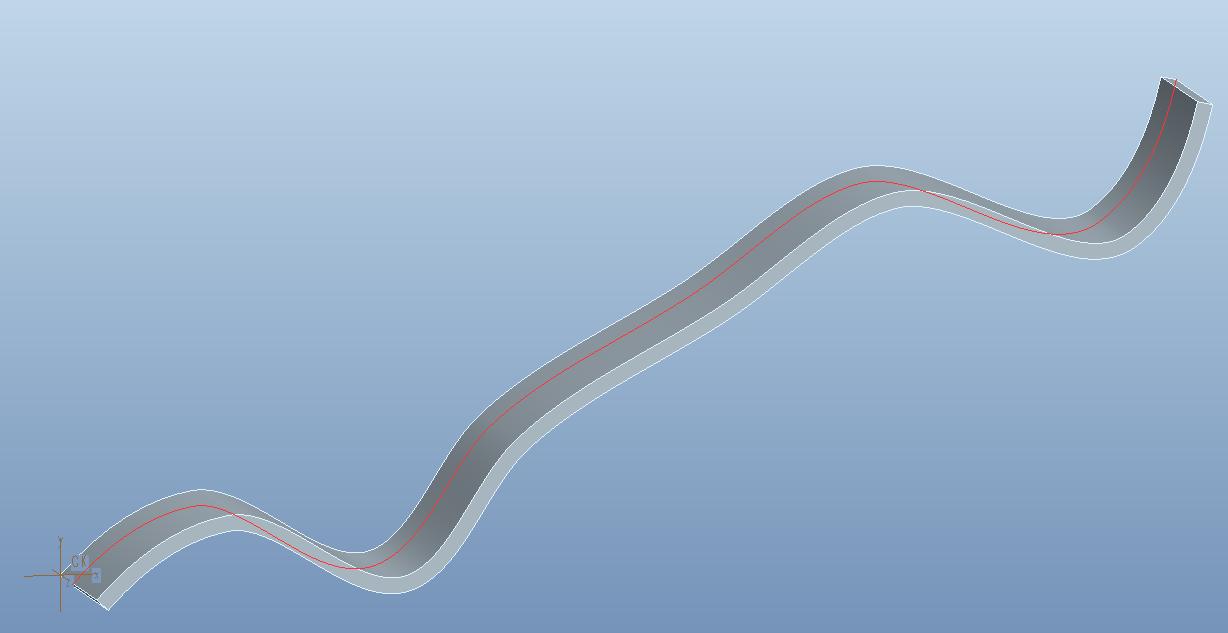
Using the STEP format I import into Pro/E part, which, accordingly, has no history of creation. In a new sketch I projecting one of the edges of the parts. Next, I want to know the coordinates of the curve relative to the axes X / Y, but with a certain step / interval, for example, every 0,5 mm. How to implement it in Pro / E (may need to use export to text file formats). Any ideas?
This thread is inactive and closed by the PTC Community Management Team. If you would like to provide a reply and re-open this thread, please notify the moderator and reference the thread. You may also use "Start a topic" button to ask a new question. Please be sure to include what version of the PTC product you are using so another community member knowledgeable about your version may be able to assist.
Labels:
- Labels:
-
2D Drawing
18 REPLIES 18
Jul 12, 2011
04:28 PM
- Mark as New
- Bookmark
- Subscribe
- Mute
- Subscribe to RSS Feed
- Permalink
- Notify Moderator
Please log in to access translation
Jul 12, 2011
04:28 PM
Hi Vladimir
Here's what I'd do. Does this help you?
Copy the edge that starts at the Origin in order to make a curve.
Create a datum plane on the Origin that represents your Y axis from the side.
Create a datum point that is constrained to the plane and the curve, and is therefore at 0, 0, 0.
Pattern the plane and the point in the X direction at 5mm intervals*. The patterned points should keep their constraint to the curve and vary in Y
Create a new curve through the new points using straight lines, not splines*
Thin extrude that curve to 100mm*
Remove the all other geometry*
Export to Alias Wavefront format (.obj) and open the exported file in notepad. That file will contain the co-ordinates based on the Co-ordinate system.
Remove the lines that include the 100 Z value (they will be grouped together and easy to delete). The Replace function can help in tidying up the file to give just the co-ordinates, or you use Excel.
I'd have done it for you but got stuck on the steps I've put asterisks on. Any tips on those? I had to select the points one by one as shift-select didnt' work.
Cheers
Jul 14, 2011
08:22 AM
- Mark as New
- Bookmark
- Subscribe
- Mute
- Subscribe to RSS Feed
- Permalink
- Notify Moderator
Please log in to access translation
Jul 14, 2011
08:22 AM
David, hello!
Thank you for your help. I think this is a tricky way to solve this problem. The main idea of the solution consists that I needed a lot of points (for accuracy), and also it is necessary to automate process of transfer of coordinates of points (manually specify each desired point is impossible). Can you please attach the document ".prt" of your solution?
Jul 12, 2011
04:57 PM
- Mark as New
- Bookmark
- Subscribe
- Mute
- Subscribe to RSS Feed
- Permalink
- Notify Moderator
Please log in to access translation
Jul 12, 2011
04:57 PM
Vladimir,
There are probably a few ways you could approach this. It may depend somewhat on how many points you need, how often you need to recalculate, and whether or not you want the data to automatically appear in a table. One approach would be to place a Datum Point on your curve at the spacing distance from the beginning of the curve, then Pattern the Point by the spacing distance as many times as you need. Then you can use Analysis Features to measure the distances from the patterned points to the reference planes. If there are not too many points and you only need to do this once this would be fairly straight forward.
David
Jul 14, 2011
08:36 AM
- Mark as New
- Bookmark
- Subscribe
- Mute
- Subscribe to RSS Feed
- Permalink
- Notify Moderator
Please log in to access translation
Jul 14, 2011
08:36 AM
David, hello!
David Butz wrote:
Vladimir,
There are probably a few ways you could approach this. It may depend somewhat on how many points you need, how often you need to recalculate, and whether or not you want the data to automatically appear in a table...
Yes, I need to use a lot of points for greater precision of further calculations (accordingly the step between points will be small). Also, this process (of obtaining the corresponding coordinates of points) need to automate.
Jul 12, 2011
05:41 PM
- Mark as New
- Bookmark
- Subscribe
- Mute
- Subscribe to RSS Feed
- Permalink
- Notify Moderator
Please log in to access translation
Jul 12, 2011
05:41 PM
Another way of doing it would be to create a UDA. You can create graphs of the X/Y data in seperate plots and export to excel. The setup would be similar to method David mentioned.
Jul 14, 2011
08:30 AM
- Mark as New
- Bookmark
- Subscribe
- Mute
- Subscribe to RSS Feed
- Permalink
- Notify Moderator
Please log in to access translation
Jul 14, 2011
08:30 AM
Kevin, hello!
Kevin wrote:
Another way of doing it would be to create a UDA. You can create graphs of the X/Y data in seperate plots and export to excel..
I understand that all these options are available in the module of Pro/E "Behavioral Modeler"?
Jul 15, 2011
10:46 AM
- Mark as New
- Bookmark
- Subscribe
- Mute
- Subscribe to RSS Feed
- Permalink
- Notify Moderator
Please log in to access translation
Jul 15, 2011
10:46 AM
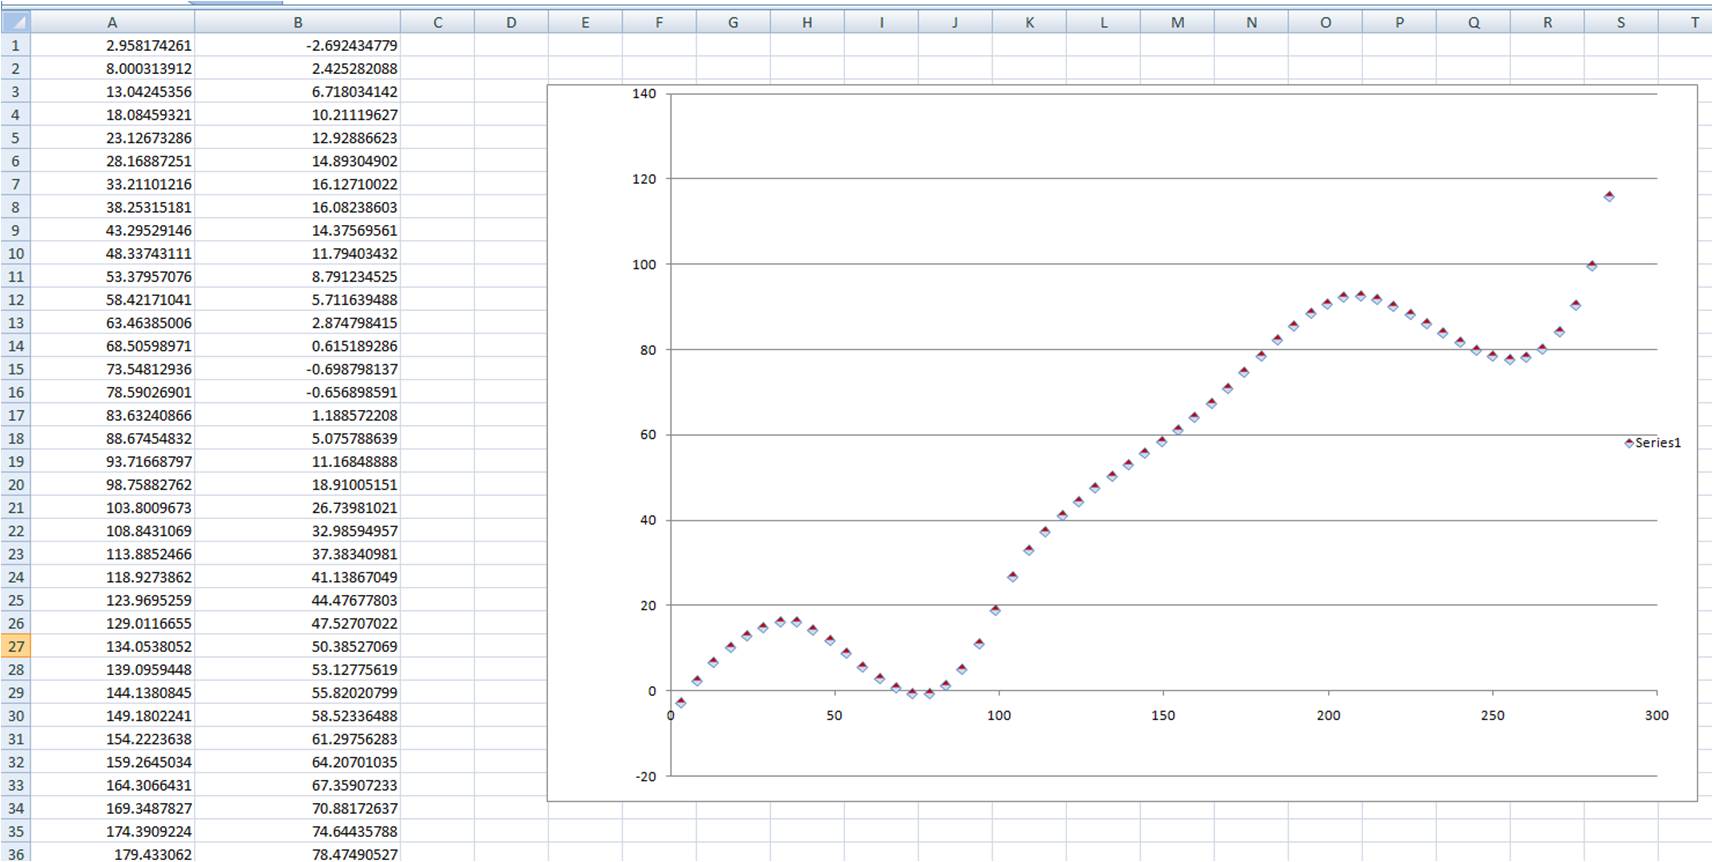
Yes. Here is the file you posted with a UDA. To see the plots in ProE select the User Defined Analysis icon or you can find in under the Analysis menu. In the dialog box that comes up there is a Saved Analysis section that shas two analyses for the X and Y data plots. You can retrieve the data and a plot will be generated. You can export the data to excel format. You need to combine the X and Y data to generate a plot and you should get something similar to this:
Jul 18, 2011
03:20 AM
- Mark as New
- Bookmark
- Subscribe
- Mute
- Subscribe to RSS Feed
- Permalink
- Notify Moderator
Please log in to access translation
Jul 18, 2011
03:20 AM
Kevin,
Thanks for an explanation and attached file Pro/E. Unfortunately, at me the license for option "Behavioral_Modeler" in Pro/E is not acquired.
Jul 18, 2011
05:09 PM
- Mark as New
- Bookmark
- Subscribe
- Mute
- Subscribe to RSS Feed
- Permalink
- Notify Moderator
Please log in to access translation
Jul 18, 2011
05:09 PM
I'm with you, Vladimir. Behavioral Modeling is great, IF you have a license. (That's why I suggested Analysis Features.)
Jul 19, 2011
01:17 AM
- Mark as New
- Bookmark
- Subscribe
- Mute
- Subscribe to RSS Feed
- Permalink
- Notify Moderator
Please log in to access translation
Jul 19, 2011
01:17 AM
I understand that.
Jul 19, 2011
10:23 AM
- Mark as New
- Bookmark
- Subscribe
- Mute
- Subscribe to RSS Feed
- Permalink
- Notify Moderator
Please log in to access translation
Jul 19, 2011
10:23 AM
My understanding is that BMX is required to create analysis features. Did something change or am I missing how the features were created originally.
Jul 19, 2011
10:42 AM
- Mark as New
- Bookmark
- Subscribe
- Mute
- Subscribe to RSS Feed
- Permalink
- Notify Moderator
Please log in to access translation
Jul 19, 2011
10:42 AM
Kevin,
Which version of Pro/E do you use?
P.S. I work in WF5 M060.
Jul 19, 2011
11:02 AM
- Mark as New
- Bookmark
- Subscribe
- Mute
- Subscribe to RSS Feed
- Permalink
- Notify Moderator
Please log in to access translation
Jul 19, 2011
11:02 AM
I'm using the same.
Jul 19, 2011
03:26 PM
- Mark as New
- Bookmark
- Subscribe
- Mute
- Subscribe to RSS Feed
- Permalink
- Notify Moderator
Please log in to access translation
Jul 19, 2011
03:26 PM
I'd have to go look to see the details, but I believe it's just a greatly truncated list of Analysis feature types that are available if you don't have BMX. I don't have the extension, much as I would like to, but use Measurement Analysis Features fairly often.
Jul 13, 2011
04:11 AM
- Mark as New
- Bookmark
- Subscribe
- Mute
- Subscribe to RSS Feed
- Permalink
- Notify Moderator
Please log in to access translation
Jul 13, 2011
04:11 AM
Thank you all for your answers! I will discuss later all the proposed solutions.
Jul 14, 2011
08:52 AM
- Mark as New
- Bookmark
- Subscribe
- Mute
- Subscribe to RSS Feed
- Permalink
- Notify Moderator
Please log in to access translation
Jul 14, 2011
08:52 AM
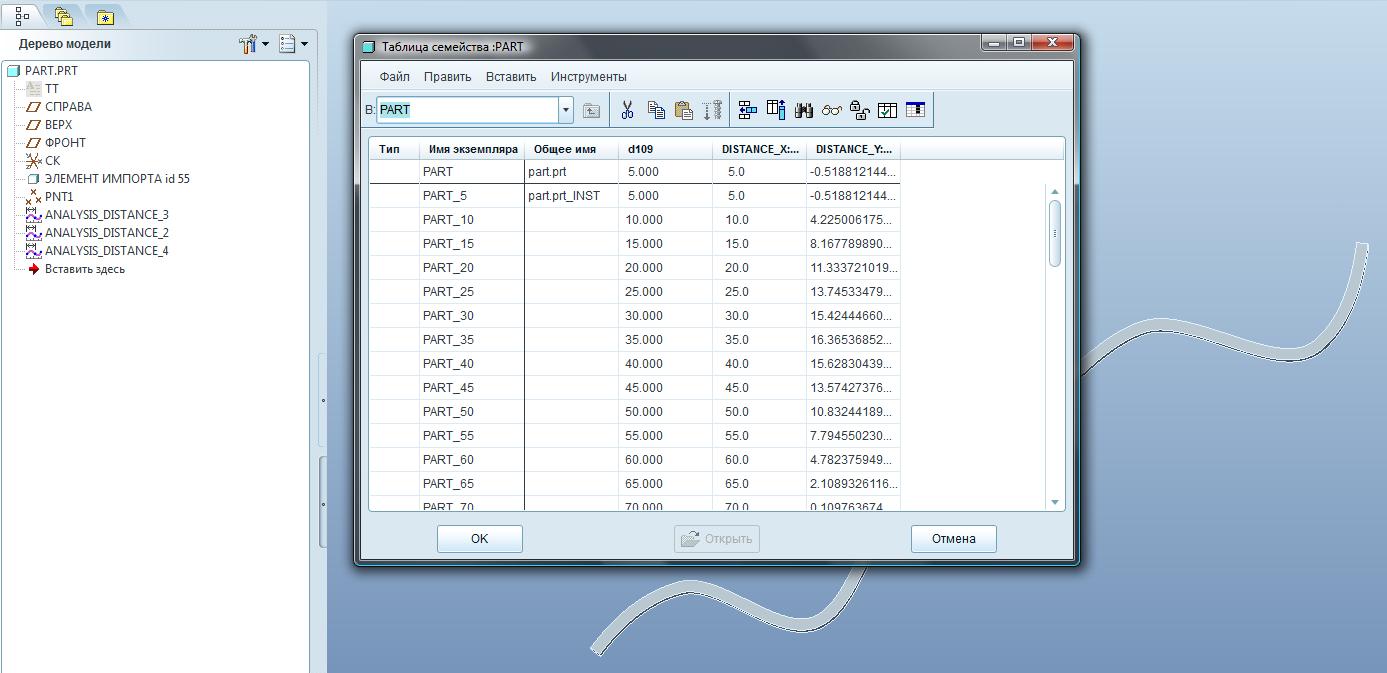
So, my colleagues have prompted to me as it is possible to automate the process of obtaining the coordinates X/Y with the desired curve. The basic idea is to use the "Analysis Feature", and then create and work with the "Family Table".
Jul 14, 2011
03:01 PM
- Mark as New
- Bookmark
- Subscribe
- Mute
- Subscribe to RSS Feed
- Permalink
- Notify Moderator
Please log in to access translation
Jul 14, 2011
03:01 PM
Very clever, Vladimir! Using a Family Table in that way was a great idea.
Jul 15, 2011
02:41 AM
- Mark as New
- Bookmark
- Subscribe
- Mute
- Subscribe to RSS Feed
- Permalink
- Notify Moderator
Please log in to access translation
Jul 15, 2011
02:41 AM
Thanks, David. It would also be interesting to see the implementation of the method proposed by Kevin:
You can create graphs of the X / Y data in seperate plots and export to excel.
P.S. In the files attached above two variants are considered:
1. The step for each of points makes 5 mm.
2. The relative step 0,01 for curve breakdown is used.


