- Community
- Creo+ and Creo Parametric
- Analysis
- Analyze model complexity
- Subscribe to RSS Feed
- Mark Topic as New
- Mark Topic as Read
- Float this Topic for Current User
- Bookmark
- Subscribe
- Mute
- Printer Friendly Page
Analyze model complexity
- Mark as New
- Bookmark
- Subscribe
- Mute
- Subscribe to RSS Feed
- Permalink
- Notify Moderator
Analyze model complexity
I'm trying to simplify a model and I'm not sure how far to go or how much it is worth my time. I'd like to know if there is a way to analyze how my simplification of a part or assembly affects the graphical performance.
For example if I take out the inner surface of all the tubes is that better than simply focusing on removing the holes.
If there was a way to create an analysis that tells me you model has ___ number of faces that might go a long way with knowing how my different simplification methods are improving model performance.
That or if there was a way to do an analysis that say your model is using ___ GPU memory.
Does anyone from the community know how to do such an analysis?
Solved! Go to Solution.
Accepted Solutions
- Mark as New
- Bookmark
- Subscribe
- Mute
- Subscribe to RSS Feed
- Permalink
- Notify Moderator
I love this question and I wish CAD companies would put more emphasis on this topic!
Our models are extremely large and the number one thing that slows us down is complex models. We use Creo and Solidworks but Solidworks wins in terms of performance evaluation for sure. It can show you open time, rebuild time, graphics triangle count.. all the good things.
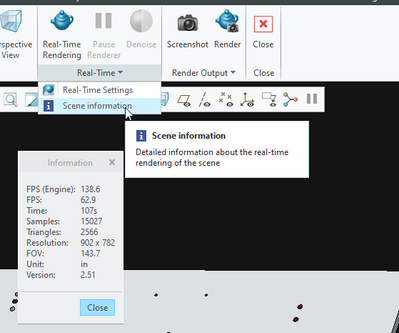
If you look on the applications tab, you may have the render studio option. If you launch that, you can find a graphics triangle count in the Real-time overflow menu, under scene information. I can't say with 100% confidence that this is what I think it is or what I use it for lol. That said, when performance sucks, this number is high. After simplification, this number goes down. This is the best equivalent to the SolidWorks functionality that I've found and it took some real digging to find it.
My company designs and builds automated machinery for just about any industry. Some of our models are absolutely gigantic so we put lots of focus on simplification. Here are a few pointers from one of the presentations I gave our users.
- Heavy models directly impact performance of commands in Creo. (Edit definition, open, close, drawing commands...)
- Heavy models slow down the speed at which you are able to zoom and pan within a model.
- Saving an assembly as a part doesn’t reduce the level of detail (LOD). Reducing the number of lines and surfaces does.
- Solidifying models should always be a priority. Non-solid models are the biggest offender in terms of performance degradation (for us).
- Drawing performance is directly related to model performance and LOD.
- When importing assemblies, you should remove internal components or components that don’t add value to the design. (Hoffman enclosures...)
- LOD matters! The fewer lines and surfaces, the better.
- Making parts transparent has a negative impact on performance.
- Some shapes impact performance more than others. Helical shapes like threads and springs require huge amounts of graphical resources.
- Model geometry that doesn’t add value should be simplified or removed.
- Simplifying your models will save you and your project team time and money!
- Mark as New
- Bookmark
- Subscribe
- Mute
- Subscribe to RSS Feed
- Permalink
- Notify Moderator
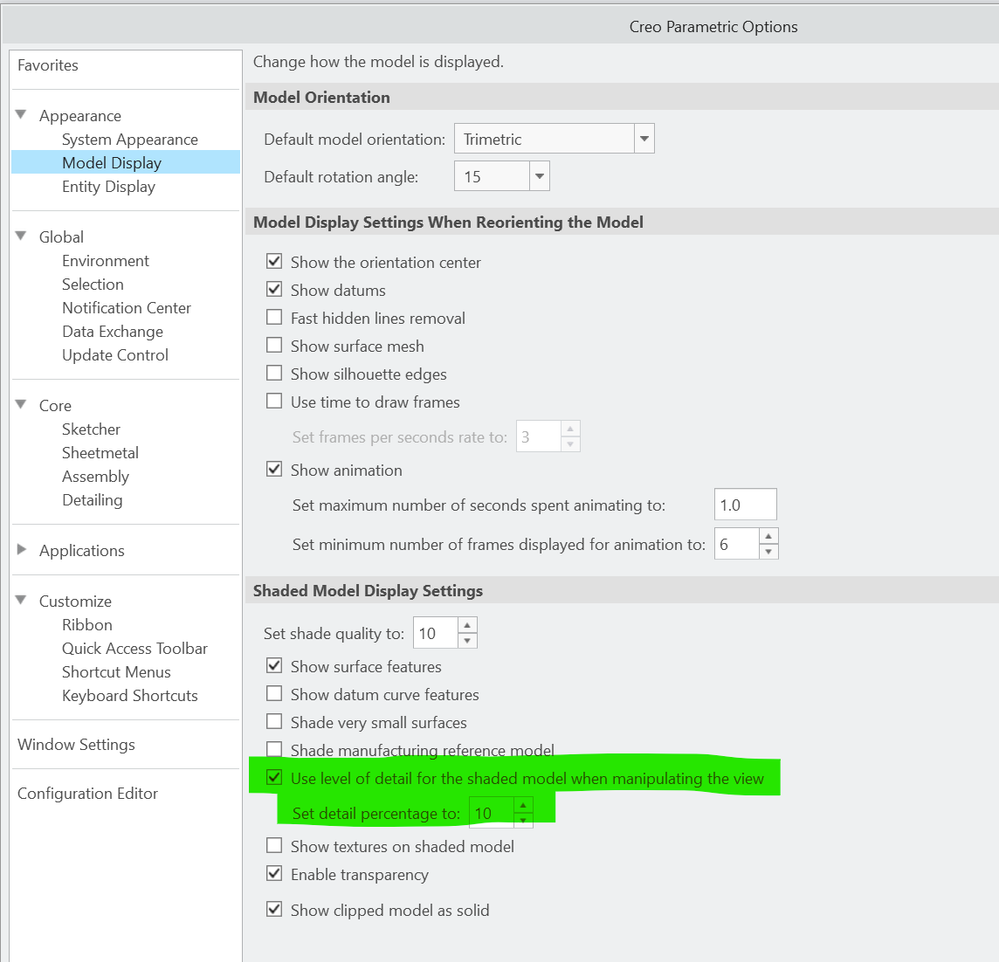
We do not change models to less detail, we let the graphics settings do this for us. I think if we are to talk LOD "level of detail" for Creo we need to talk about the configuration settings that optimize large, detailed assembly visualization. Here is a screen shot that highlights the LOD setting and other settings to enhance GPU performance that do not require actually defeaturing a model. If you look at other CAD software, the settings are by default pretty low LOD so that performance looks great but you see parts turn into cubes as you rotate a model. Also, the display for lines and wireframe etc, can be changed in Creo in a way that improves performance dramatically. These can be set low while working with a model but increased when needed for documentation/drawings/visuals. Also, you could use windows task manager to monitor the GPU including its memory to see how these settings or changes to the model detail affect usage. If you want to get fancy, you can setup a replay of a trail file to run a model spin sequence and time it over various settings or model details on/off. Batch file example of how to do some benchmarking attached.


