Community Tip - Learn all about PTC Community Badges. Engage with PTC and see how many you can earn! X
- Community
- Creo+ and Creo Parametric
- Analysis
- Re: Creo4.0 convergence plots
- Subscribe to RSS Feed
- Mark Topic as New
- Mark Topic as Read
- Float this Topic for Current User
- Bookmark
- Subscribe
- Mute
- Printer Friendly Page
Creo4.0 convergence plots
- Mark as New
- Bookmark
- Subscribe
- Mute
- Subscribe to RSS Feed
- Permalink
- Notify Moderator
Creo4.0 convergence plots
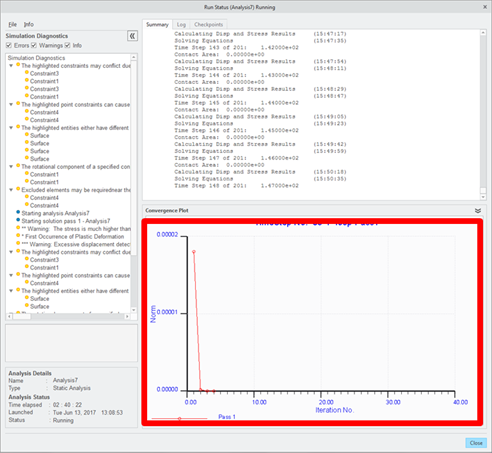
Does anyone know how to control what is displayed in the graph?

I opened the run status again and the graph displayed Deflection vs load
I couldn't get back to the norm vs iteration
I couldn't see a right click or anything in the menus,
I re-opened the run status a 'random' number of times and it went back to deflection.
I must have missed something.
Thanks
- Labels:
-
General
- Mark as New
- Bookmark
- Subscribe
- Mute
- Subscribe to RSS Feed
- Permalink
- Notify Moderator
Then I managed to get my axes to go green somehow and no graph.
- Mark as New
- Bookmark
- Subscribe
- Mute
- Subscribe to RSS Feed
- Permalink
- Notify Moderator
Hello
I´m just testing Creo 4.0 M70 in Windows 10 and I had the same question:
_ Have you found a way to control the plot that appears in the Run Status?
Also, I understand what you mean with the "green axes". I also got this strange behavior!
However, I found something even worst.
If you get it when running simulation, you will also have problem if later you want to display your result as a "graph".
The graph is empty and Creo does not actualize the graph scale whatever the measure you choose. It keeps showing only “time” scale in both axes.
Its looks like a bug. I´ll try to pay attention how to cause it and contact PTC.
It may be related in switching CAD models during simulation or similar event that make you leave the simulation – not so easy to reproduce.
In case that your Graph is empty, re-starting Creo (not only the model) usually solves this problem.
- Mark as New
- Bookmark
- Subscribe
- Mute
- Subscribe to RSS Feed
- Permalink
- Notify Moderator
I don´t even have that plot! (check image)
Did you try to plot it as a result window?

- Mark as New
- Bookmark
- Subscribe
- Mute
- Subscribe to RSS Feed
- Permalink
- Notify Moderator
Still doesn't work
- Tags:
- simulate
- Mark as New
- Bookmark
- Subscribe
- Mute
- Subscribe to RSS Feed
- Permalink
- Notify Moderator
Creo 7.0.5.0 W10


