Community Tip - Need to share some code when posting a question or reply? Make sure to use the "Insert code sample" menu option. Learn more! X
- Community
- Creo+ and Creo Parametric
- Analysis
- Force/Displacement graph
- Subscribe to RSS Feed
- Mark Topic as New
- Mark Topic as Read
- Float this Topic for Current User
- Bookmark
- Subscribe
- Mute
- Printer Friendly Page
Force/Displacement graph
- Mark as New
- Bookmark
- Subscribe
- Mute
- Subscribe to RSS Feed
- Permalink
- Notify Moderator
Force/Displacement graph
Hi,
I am struggling to get a force-displacement graph under increasing force like below;
I already read a related topic started by ptc-4273428 in this community, but I'm afraid that I failed to understand it totally. I tried to make it with a simple beam model for test, but I just could get graphs that have X-axis presenting length of the beam (position on the edge of the beam), not increasing force.
Are there anyone can show me the way to get the force-displacement graph in another way?
Thanks,
HJ
Solved! Go to Solution.
- Labels:
-
Simulate
Accepted Solutions
- Mark as New
- Bookmark
- Subscribe
- Mute
- Subscribe to RSS Feed
- Permalink
- Notify Moderator
See attached Images.
In summary:
Use non-linear / load Histories
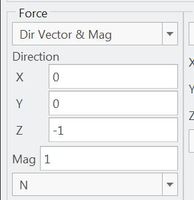
Apply unit Load
In the analysis definition - Load Time dependence...
Define a FUNCTION vs time for the load value
In the Analysis definition - Output
make sure the final master step = final time in your time dependence.
make sure you have enough master steps and spacing to make a good chart.
Define a measure for the displacement. (do not select time dependence)
When plotting results you may need to export to excel and scale the TIME by the appropriate weight from your FUNCTION to obtain the applied load. In my example the time = the load applied because I apply 1N * 100 at final time of 100. and evenly ramp from zero load. (my FUNCTION has slope = 1)
If this does not answer your question please upload your image using either "Choose Files" or the CAMERA icon in the formatting bar.
- Mark as New
- Bookmark
- Subscribe
- Mute
- Subscribe to RSS Feed
- Permalink
- Notify Moderator
Hi sweetpeahub,
Thank you so much for very helpful reply.
The key point of your lesson to me was using the 'measure'.
I learned that when the 'measure' selected for the vertical axis, I could choose the 'time' for the horizontal axis.(attached image)
Now, I have another question. Can I let the horizontal axis show the 'Force', not the time?
I thought I can use the measure for the x-axis, and because there is not the Force in the predefined measure list, I tried to define a measure that present the force, but it is not simple...
- Mark as New
- Bookmark
- Subscribe
- Mute
- Subscribe to RSS Feed
- Permalink
- Notify Moderator
This equation for load as function of time:
AppliedLoad(time) = LoadMagnitude * TimeFunction(time)
This has loadmagnitude = 1
This has TIME_FUNCTION(time)
3 ways. Way 1 and 2 discussed in previous post. I will re-state.
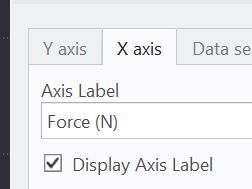
1. Have 1:1 slope for time vs load applied. Just the label is incorrect. Change the label.
2. Save-as the graph "deflection vs time" to Excel .xls (or .grt which is text file) and use spreadsheet (Like Excel) to convert time to load. Compute or enter the load manually in spreadsheet. XY chart in spreadsheet.
3. In some cases the input force applied is found by the reaction force in the same direction at the constraint. Since load vector = -1Z then Reaction Z. This is a simple FEA. Verify results are correct for other FEA problems.
- Mark as New
- Bookmark
- Subscribe
- Mute
- Subscribe to RSS Feed
- Permalink
- Notify Moderator


