Community Tip - Want the oppurtunity to discuss enhancements to PTC products? Join a working group! X
- Community
- Creo+ and Creo Parametric
- Analysis
- Re: Laminate Layup and Simulate Results
- Subscribe to RSS Feed
- Mark Topic as New
- Mark Topic as Read
- Float this Topic for Current User
- Bookmark
- Subscribe
- Mute
- Printer Friendly Page
Laminate Layup and Simulate Results
- Mark as New
- Bookmark
- Subscribe
- Mute
- Subscribe to RSS Feed
- Permalink
- Notify Moderator
Laminate Layup and Simulate Results
We have found problems when analyzing FEM results of laminate layups. The problems occur when you have forces in normal direction of a laminate layup. I will show a simplified model below to show you the problem and then I hope you can guide me to a solution.
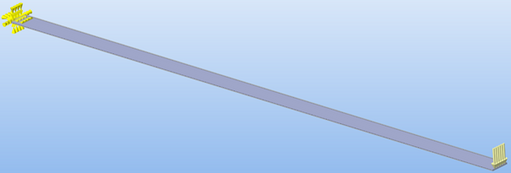
Model: Composite beam. Fully constrained at one side and a normal force of 10 N at the other side. A surface of 20 mm width x 600 mm long is creating the test object. This surface is simplified as a shell with a composite laminate attached to it.
The laminate consists of two 1 mm layer.
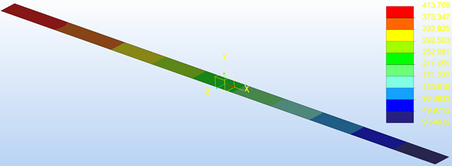
Results according to von Mises shows:
Same stresses as hand calculations are obtained (225 MPa at the middle of the beam). No problems so long.
Now to the problem. When you are running a composite analyze you want to analyze the results in failure-index, not von Mises. Failure-index compares tensile and compressive stresses against specified limits in the material data.
Following is obtained when showing maximum failure-index results at all plies:
Failure index = 0 at the hole beam.
Following is obtained when showing maximum failure-index results at ply 1:
Failure index = 0.9 at the center of the beam. Correct value in compression (225/250 = 0.9).
Following is obtained when showing maximum failure-index results at ply 2:
Failure index = 0 at the hole beam.
Changed force direction:
If I change the direction of the force, to opposite direction, following results are obtained.
- Same results when looking at all plies.
- Ply 1 is changed from compression to tensile. A new Failure Index is generated of 0.45 (225/500), at the middle of the beam. The value is correct according to tensile limit.
- Same results when looking at ply 2.
Conclusion:
- Failure Index – Maximum – of all plies: do not find the highest Failure index.
- Failure Index – Maximum – of ply top/bottom – Ply Number 2: is not analyzing both sides of the ply, even when it says “of ply top/bottom”. It should give a Failure Index of 0.45 (225/500).
- Different results when flipping force direction. From compressive to tensile.
Question:
Does anyone understand why Creo is generating these results? We really hope we can find a logical explanation to be able to rely on future results. We really appreciate all the help we can get!
- Labels:
-
Simulate
- Mark as New
- Bookmark
- Subscribe
- Mute
- Subscribe to RSS Feed
- Permalink
- Notify Moderator
@ptc-387617 wrote:
We have found problems when analyzing FEM results of laminate layups. The problems occur when you have forces in normal direction of a laminate layup. I will show a simplified model below to show you the problem and then I hope you can guide me to a solution.
Model: Composite beam. Fully constrained at one side and a normal force of 10 N at the other side. A surface of 20 mm width x 600 mm long is creating the test object. This surface is simplified as a shell with a composite laminate attached to it.
The laminate consists of two 1 mm layer.
Results according to von Mises shows:
Same stresses as hand calculations are obtained (225 MPa at the middle of the beam). No problems so long.
Now to the problem. When you are running a composite analyze you want to analyze the results in failure-index, not von Mises. Failure-index compares tensile and compressive stresses against specified limits in the material data.
Following is obtained when showing maximum failure-index results at all plies:
Failure index = 0 at the hole beam.
Following is obtained when showing maximum failure-index results at ply 1:
Failure index = 0.9 at the center of the beam. Correct value in compression (225/250 = 0.9).
Following is obtained when showing maximum failure-index results at ply 2:
Failure index = 0 at the hole beam.
Changed force direction:
If I change the direction of the force, to opposite direction, following results are obtained.
- Same results when looking at all plies.
- Ply 1 is changed from compression to tensile. A new Failure Index is generated of 0.45 (225/500), at the middle of the beam. The value is correct according to tensile limit.
- Same results when looking at ply 2.
Conclusion:
- Failure Index – Maximum – of all plies: do not find the highest Failure index.
- Failure Index – Maximum – of ply top/bottom – Ply Number 2: is not analyzing both sides of the ply, even when it says “of ply top/bottom”. It should give a Failure Index of 0.45 (225/500).
- Different results when flipping force direction. From compressive to tensile.
Question:
Does anyone understand why Creo is generating these results? We really hope we can find a logical explanation to be able to rely on future results. We really appreciate all the help we can get!
Hi,
please open Case at support.ptc.com and repeat your question to PTC Support people.
Martin Hanák
- Mark as New
- Bookmark
- Subscribe
- Mute
- Subscribe to RSS Feed
- Permalink
- Notify Moderator
Hi,
please refer to both articles:
https://www.ptc.com/en/support/article/CS345684
and
https://www.ptc.com/en/support/article/CS347331
thank you
Regards
Mustapha
- Mark as New
- Bookmark
- Subscribe
- Mute
- Subscribe to RSS Feed
- Permalink
- Notify Moderator


