- Community
- IoT & Connectivity
- IoT & Connectivity Tips
- Why Use InfluxDB in a Small ThingWorx Application
- Subscribe to RSS Feed
- Mark as New
- Mark as Read
- Bookmark
- Subscribe
- Printer Friendly Page
- Notify Moderator
Why Use InfluxDB in a Small ThingWorx Application
When to Include InfluxDB in the ThingWorx Development Lifecycle
(this article is also available for download as a PDF attached)
The Short Answer
InfluxDB is a time series database designed specifically for data ingestion. Historically, InfluxDB has been viewed as a high-scale expansion option for ThingWorx: a way to ensure the application works as intended, even when scaled up to the enterprise level. This is certainly one way to view it, because when there are many, many remote things, each with a lot of properties writing to the Platform at short intervals, then InfluxDB is a sure choice. However, what about in smaller applications? Is there still a benefit to using an optimized data ingestion tool in any case? The short answer is: yes, there is!
Using InfluxDB for optimized data ingestion is a good idea even in smaller-sized applications, especially if there are plans to scale the application up in the future. It is far better to design the application around InfluxDB from the start than to adjust the data model of the application later on when an optimized data ingestion process is required. PostgreSQL and InfluxDB simply handle the storage of data in different ways, with the former functioning better with many Value Streams, and the latter with fewer Value Streams. Switching the way data is retained and referenced later, when the application is already on the larger side, causes delays in growing the application larger and adding more devices. Likewise, if the Platform reaches its ingestion limits in a production environment, there can be costly downtime and data loss while a proper solution (which likely involves reworking the application to work optimally with InfluxDB) is implemented.
Don’t think that InfluxDB is for expansion only; it is an optimized ingestion database that has benefits at every level of the application development lifecycle. From the end to end, InfluxDB can ensure reliable data ingestion, reduced risk of data loss, and reduced memory and CPU used by the deployment overall. Preliminary sizing and benchmark data is provided in this article to explain these recommendations. Consider how ThingWorx is ingesting data now, how much CPU and other resources are used just for acquiring the data, and perhaps InfluxDB would seem a benefit to improve application performance.
The Long Answer
In order to uncover just how beneficial InfluxDB can be in any size application, the IoT Enterprise Deployment Center has run some simulations with small and medium sized applications. The use case in the simulation is simple with user requests coming from a collection of basic mashups and data ingestion coming from various numbers of things, each with a collection of “fast” and “slow” properties which update at different rates. This synthetic load of data does not include a more complete application scenario, so the memory and CPU usage shown here should not be used as sizing recommendations. For those types of recommendations, stay tuned for the soon-to-release ThingWorx 9.0 Sizing (or check out the current 8.5 Sizing Guide).
Comparing Runs
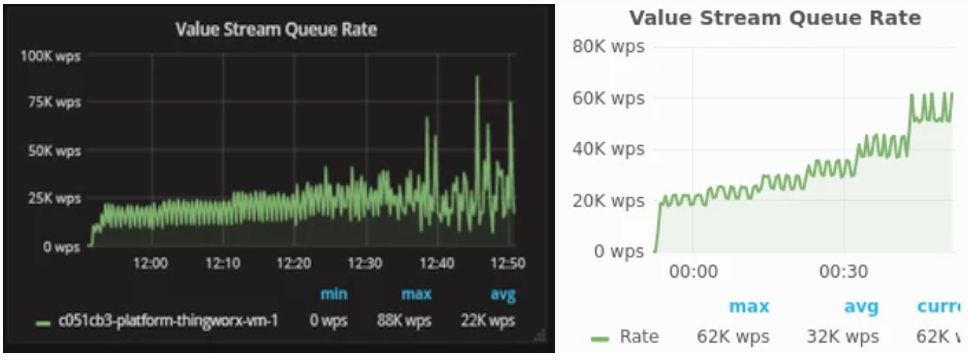
When determining the health of the ThingWorx Platform, there are several categories to inspect: Value Stream Queue Rate and Queue Size, HTTP Requests, and the overall Memory and CPU use for each server. Using Grafana to store the metrics results in charts like those below which can easily be compared and contrasted, and used to evaluate which hardware configuration results in the best performance. The size of the numbers on the vertical axis indicate total numbers of resources used for that metric, while the slope or trend of each chart indicates bottlenecks and inadequate resource allocation for the use case.
In this case, all darker charts represent data from PostgreSQL ONLY configurations, while the lighter charts represent the InfluxDB instances. Because this is not a sizing guide, whether each of these charts comes from the small or medium run is unimportant as long as they match (for valid comparisons between with Influx and without it). The smaller run had something like 20k Things, and the larger closer to 60k, both with 275 total Platform users (25 Admins) and 3 mashups, which were each called at various refresh rates over the course of the 1-hour testing period. Note that in the PostgreSQL ONLY instances, there were more Thing Templates and corresponding Value Streams. This change is necessary between runs because only with fewer Value Streams does InfluxDB begin to demonstrate notable improvements.
The most important thing to note is that the lighter charts clearly demonstrate better performance for both size runs. Each section below will break down what the improvement looks like in the charts to show how to use Grafana to verify the best performance.
Value Stream Queue
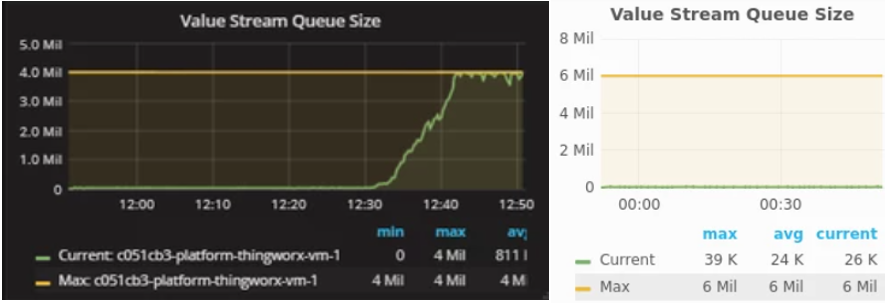
The vertical axis on the Value Stream Queue Rate chart shows how many total writes per minute (WPS) the Platform can handle. The average is 10 WPS higher using InfluxDB in both scenarios, and InfluxDB is also much more stable, meaning that the writes happen more reliably. The Value Stream Queue Size chart demonstrates how well the writes within the queue are processed. Both of these are necessary to determine the health of data ingestion.
If the queue size were to increase and trend upward in the lighter Queue Size chart, then that would mean the Platform couldn’t handle the higher ingestion rate. However, since the Queue Size is stable and close to 0 the entire time, it is clear that the Platform is capable of clearing out the Value Stream Queue immediately and reliably throughout the entire test.


HTTP Requests
Taking the strain of ingestion off of the Platform’s primary database frees its resources up for other activities. This in turn improves the performance and reliability of the Platform to respond to HTTP requests, those which in a typical application are used to aggregate data into smaller data stores (depending on the use case) and which render the mashups for the end users. The business logic and mashups can be more complex when there is one database designated for ingestion (InfluxDB) and one for everything else (PostgreSQL).

Likewise, the nature of Postgres lends well towards this differentiation, given that there are many more database tables required for supporting the HTTP requests, something Postgres does well. That leaves Influx to handle the time-series data and ingestion, and those are the primary strengths of that software as well. So, splitting the load across multiple servers in this way results in smaller server sizes overall, each which is stream-lined and optimized to handle exactly what it is given by the Platform.
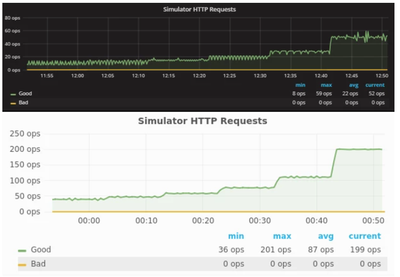
Note that in both of these charts, there are no bad requests, so both would seem to be successful runs. However, as future charts will demonstrate more clearly, there is a catastrophic failure when the load is increased around 12:30p. The simulation ends before the server begins to show any real symptoms of the issue, and that is why there are no bad requests. The maximum Operations Per Second (OPS) in the Hardware Specifications and Performance section is taken from before the failure begins.
Clearly the InfluxDB instance has better performance given that the average Operations Per Second (OPS) is substantially higher, nearly 4 times what is seen in the PostgreSQL ONLY instance. Obviously how well the Platform manages the business logic and mashup loading will depend on a lot of factors. In this test scenario, the OPS was increased by increasing the mashup refresh rate on the InfluxDB instances (which could handle over double the operations). Likewise, the number of Stream writes to the PostgreSQL database could be double what it was when PostgreSQL was the only database. Therefore, configuring InfluxDB for the data ingestion and leaving Postgres for the rest of the application certainly makes the load much easier on the Platform, and the same would be true even in a much more complex scenario.
Memory and CPU
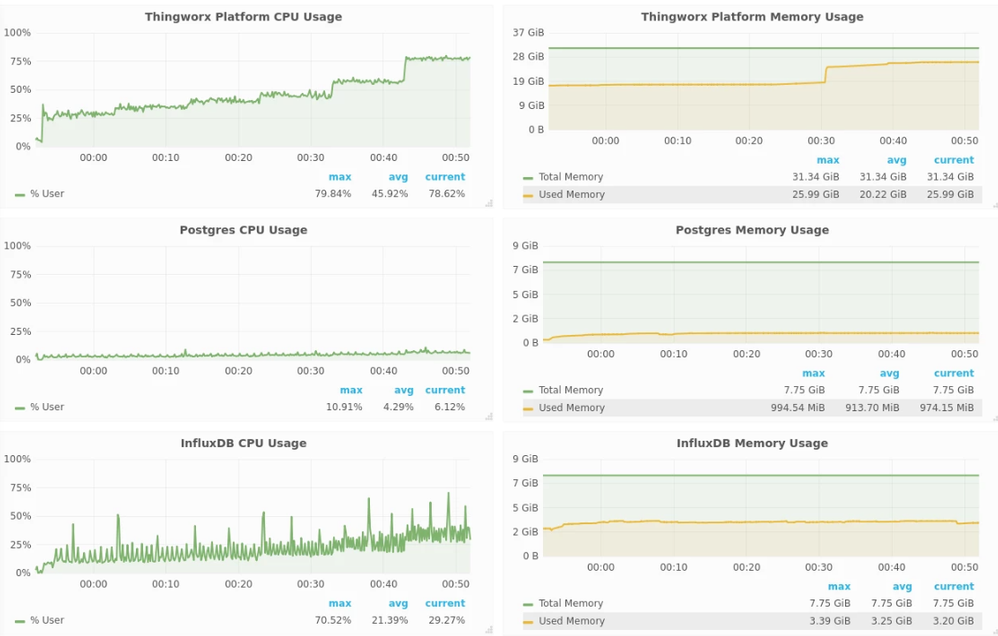
The important thing here is to keep the memory use low enough that any spikes in usage won’t cause a server malfunction. CPU Usage should stay at or below around 75%, and Memory should never exceed around 80% of the total allocated to the server. The sizing guides can help determine what this allocation of memory needs to be.
Of note in these charts is the slight, upward slope of the CPU usage in the darker chart, indicating the start of a catastrophic failure, and the difference in the total memory needed for the ThingWorx Platform and Postgres servers when Influx is used or not. As is apparent, the servers use much less memory when the database load is split up intelligently across multiple servers.


Hardware Specifications and Performance
These are the exact specifications for each simulated instance, broken down by size and whether InfluxDB is configured or not. Note that some of the hardware specifications may be more than is necessary real-world use case depending. As stated previously, this document is not a sizing guide (use the official ThingWorx Sizing Guide).
Note that the maximum number of WPS and OPS are shown here. The maximums are higher in the InfluxDB scenarios, meaning that even with smaller-sized servers, the InfluxDB configurations can handle much greater loads.
Summary
In conclusion, if InfluxDB may at some point be needed in the lifecycle of an application, because the expected number of things or the number of properties on each thing is large enough that it will max the limitations of the Platform otherwise, then InfluxDB should be used from the very start. There are benefits to using InfluxDB for data ingestion at every size, from performance to reliability, and of course the obviously improved scalability as well.
Reworking the application for use with InfluxDB later on can be costly and cause delays. This is why the benefits and costs associated with an InfluxDB-centric hardware configuration should be considered from the start. More servers are required for InfluxDB, but each of these servers can be sized smaller (depending on the use case), and all of this will affect the overall cost of hosting the ThingWorx application. The benefits of InfluxDB are especially pronounced when used in conjunction with clusters, which will be demonstrate fully in the 9.0 Sizing Guide (soon to be released). If InfluxDB is used to interface with the clusters, then there are even more resources to spare for user requests.
It is considered ThingWorx best practice for high ingestion customers to make use of InfluxDB in applications of any size. Note, though, that this will mean the number of Value Streams per Influx Database will need to be limited to single digits. We hope this helps, and from everyone here at the EDC, happy developing!
- Mark as Read
- Mark as New
- Bookmark
- Permalink
- Notify Moderator
For sure InfluxDB it's better suited for timeseries data ingestion, but that's maybe an unfair comparison. You are comparing 1 Single Server as Database provider with 2 Servers as Database providers, you are splitting the load in two servers (one for model and the other for TimeSeries). To make the comparision more fair you need to set two PostgreSQL servers one for Model and the other for TimeSeries:
- Test Set 1:
- 1 PostgreSQL server for Model
- 1 PostgreSQL server for TimeSeries
- Test Set 2:
- 1 PostreSQL server for Model
- 1 InfluxDB server for TimeSeries
Just my thoughts.
Carles
- Mark as Read
- Mark as New
- Bookmark
- Permalink
- Notify Moderator
Thanks for the input, Carles!
Yes - I would agree that you could also create some additional scalability by simply using multiple instance of any data provider. The decision-making process here may come down to the types of business logic that your application needs to implement - or the skillset of the teams that implement them.
As a example - some of our customers and partners choose to take advantage of stored procedures in either Microsoft SQL Server or PostgreSQL as part of their overall IOT application. In such a model, there could be value in distributing data or logic onto separate instances, at the expense of a bit more complexity of managing application business logic in multiple places and formats.
If there is significant community interest, we could prioritize a "multiple data provider instances" test as a comparison in the future.
Please like/kudo this post if that would be valuable!
- Mark as Read
- Mark as New
- Bookmark
- Permalink
- Notify Moderator
Dear EDC,
Customer have migration plan PostgreSQL to InfluxDB.
Post described " Note, though, that this will mean the number of Value Streams per Influx Database will need to be limited to single digits" but currently they have value stream per thing and thing number is over 100.
So does customer need to reducing value stream number when customer move from PostgreSQL to InfluxDB?
Note : Their migration plan can be changed according to this.
- Mark as Read
- Mark as New
- Bookmark
- Permalink
- Notify Moderator
Thanks for the question!
In general, we have observed better performance - both in terms of scale and data rate - from having a lower number of ThingWorx ValueStreams. A "one ValueStream for each Thing" model may work, but will not perform well.
For ThingWorx implementations with larger asset fleets, this could mean breaking down the fleet by some attribute that makes sense for the business (product family, model number, etc.) and having a ValueStream defined for that business group.
One way to do this could be to define a ValueStream at the ThingTemplate level - then all things based on that Template will share that ValueStream.
For smaller asset fleets, a single ValueStream for all assets can also be an option. In our Remote Monitoring of Assets Reference Benchmark, we had 5,000 assets per ValueStream which worked very well.
I hope that helps!
- Mark as Read
- Mark as New
- Bookmark
- Permalink
- Notify Moderator
The following article states that there is a performance hit in querying responsiveness at 100,000 records.
https://www.ptc.com/en/support/article/CS204091
Q1: Does this apply to InfluxDB also? Or does it only apply to RDBMS like SQL server and PostgreSQL?
Q2: I see InfluxDB is more performant in data ingestion. Is it more performant in data processing as well?
Q3: I have a model that generates 500 records/week/asset with 50 properties. There are less than 100 assets of this model. Should this model use one stream with InfluxDB as it's persistence provider? I don't think we will be purging the data periodically.


