- Community
- IoT & Connectivity
- IoT & Connectivity Tips
- Deploy Statistical Process Control Part 2
- Subscribe to RSS Feed
- Mark as New
- Mark as Read
- Bookmark
- Subscribe
- Printer Friendly Page
- Notify Moderator
Deploy Statistical Process Control Part 2
Step 3: Monitor SPC Properties
Once the properties have been configured, you are ready to progress on to SPC monitoring.
This is done by viewing the PTC.SPC.Monitoring_MU Mashup.
NOTE: Once a property has been configured for SPC monitoring, 2-5 minutes must pass before the accelerator has collected enough streaming values to perform SPC calculations. During this time, you may see an item that has 2 OOC rules violated; “Collecting Enough Data to Begin Monitoring” and “… to Compute Capability”.
-
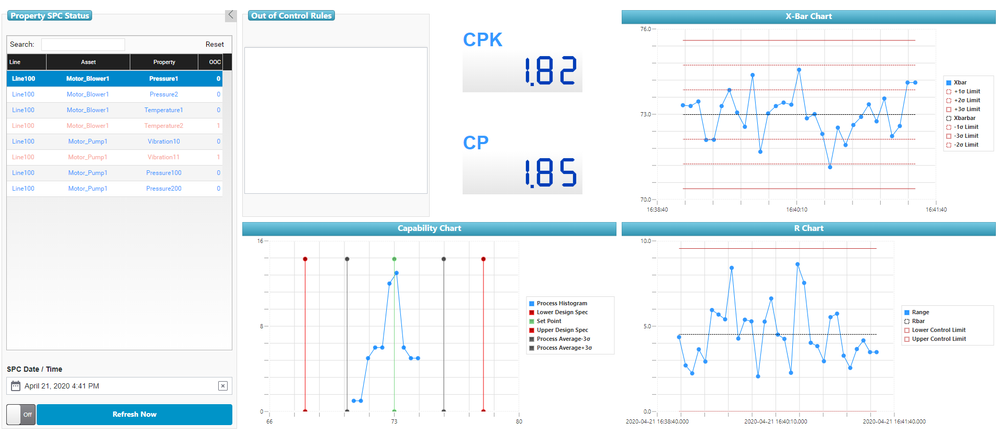
Within Property SPC Status, click an item from the grid that has 0 in the OOC column.
- See that the Out of Control Rules area is blank, since there are no currently-violated SCP rules for that selected property.
- Both CP and CPK are above 1.0, showing that the process is capable.
- All the points in the charts are blue, as they do not violate any OOC rules.
-
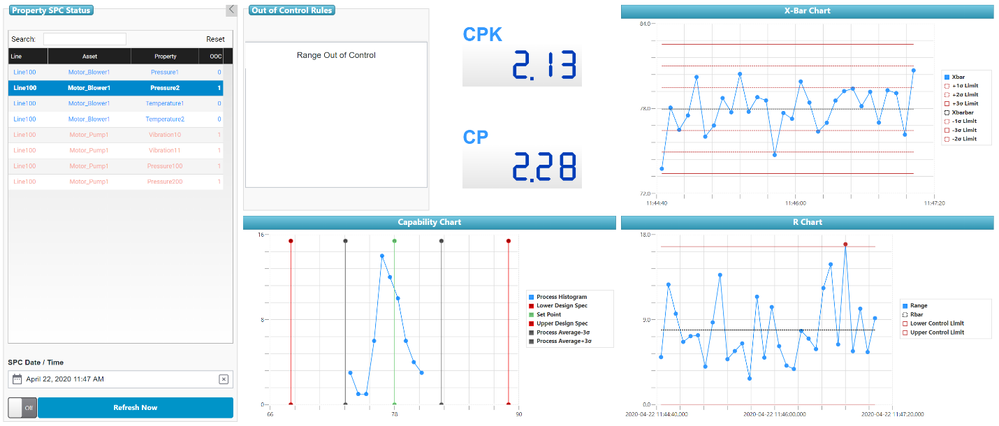
Within Property SPC Status, click an item from the grid that has a nonzero number in the OOC column.
- See that the Out of Control Rules area has one or more rules listed that are currently being violated.
- Here, the rule being violated is Range Out of Control.
- One or more of the charts may have point(s) that are red.
- Here, you can see one of the points in the R chart is red, as it is above the Upper Control Limit.
- See that the Out of Control Rules area has one or more rules listed that are currently being violated.
-
In the bottom-left, click Refresh Now.
- Note that the datetime value of the date picker in the lower-left indicates the period to which the Mashup has updated.
- It is possible that Properties that were previously not in violation are now violating OOC rules; the opposite is also possible.
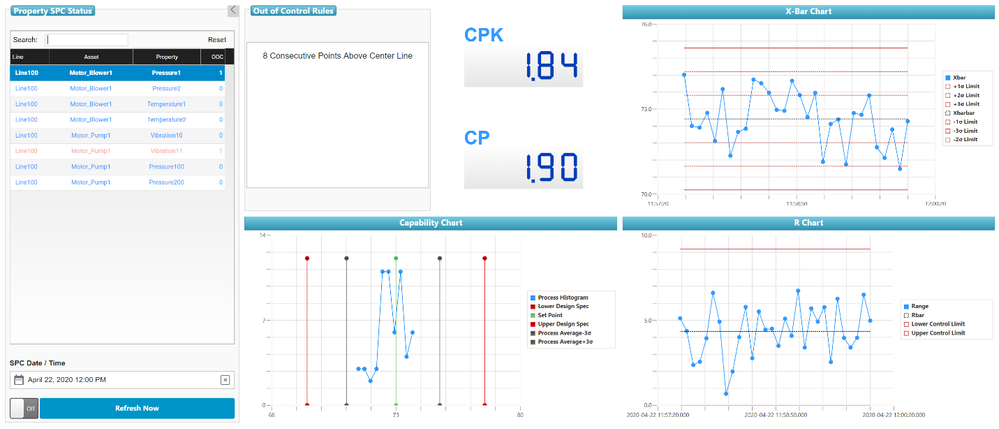
- Note that not all points that violate an OOC rule will display in red.
- Here, you can see that the rule 8 Consecutive Points Above Center Line is violated, but the corresponding points in the X-Bar Chart are not red.
-
View the SPC status at a time from the recent past.
- In the lower-left, click date picker.
- Choose a datetime of 2-3 minutes in the past.
- You will see that the date picker reflects the datetime value you selected.
- All the Widgets in the Mashup are updated to reflect their status at that point in time.
-
Enter continuous monitoring mode.
-
Select any of the eight (8) items from the Property SPC Status area.
-
To the left of the Refresh Now button, click the toggle.
- This will enable the Mashup to auto-refresh every 30 seconds.
-
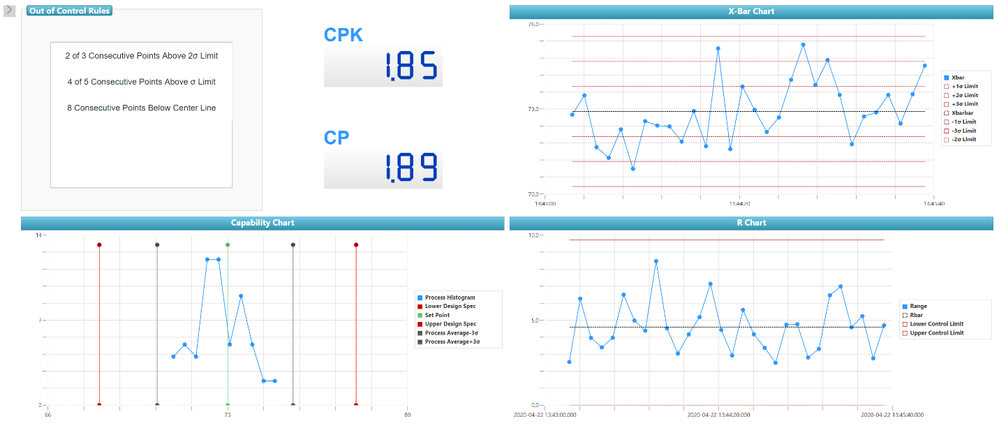
In the upper-right corner of the Property SPC Status area, click the gray arrow to expand the monitoring display.
- Every 30 seconds, the monitoring display will update to show the most recent status for the item you selected.
-
Step 4: Next Steps
Congratulations! You’ve successfully completed the Deploy Statistical Process Control guide, and learned how to:
- Configure multiple properties for SPC monitoring
- Identify abnormalities in streaming property values
Learn More
We recommend the following resources to continue your learning experience:
Site Link
| Wikipedia | Western Electric Rules |
| Wikipedia | Process Capability |
Additional Resources
If you have questions, issues, or need additional information, refer to:
Resource Link
| Community | Developer Community Forum |
| Support | ThingWorx Help Center |


