Enhanced Engine Failure Visualization Part 2
- November 7, 2022
- 0 replies
- 671 views
Step 5: Contained Mashup
Our Minimum Viable Product (MVP) Mashup which we created in the last guide did have valid information.
Being able to display the inputs coming from the engine, as well as the analytical results coming from ThingWorx Analytics, are certainly items we don’t want to lose in this new, more complete Mashup.
Rather than recreating that work from scratch, we’ll simply include that previous Mashup in one of our sub-section via the Contained Mashup Widget.
1. Click on the top-left section to select it, and ensure that you’re on the Widgets tab in the top-left.
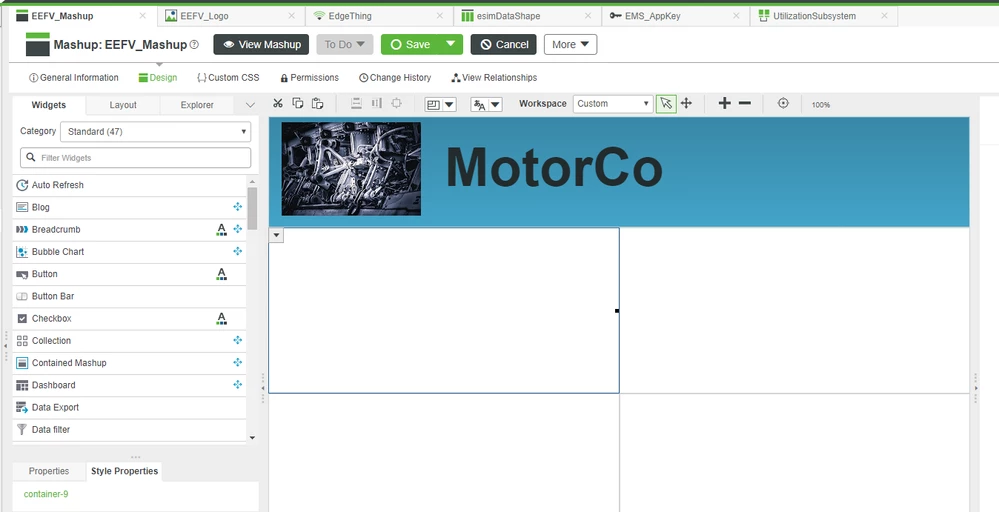
2. Drag-and-drop a Contained Mashup Widget onto the top-left section.
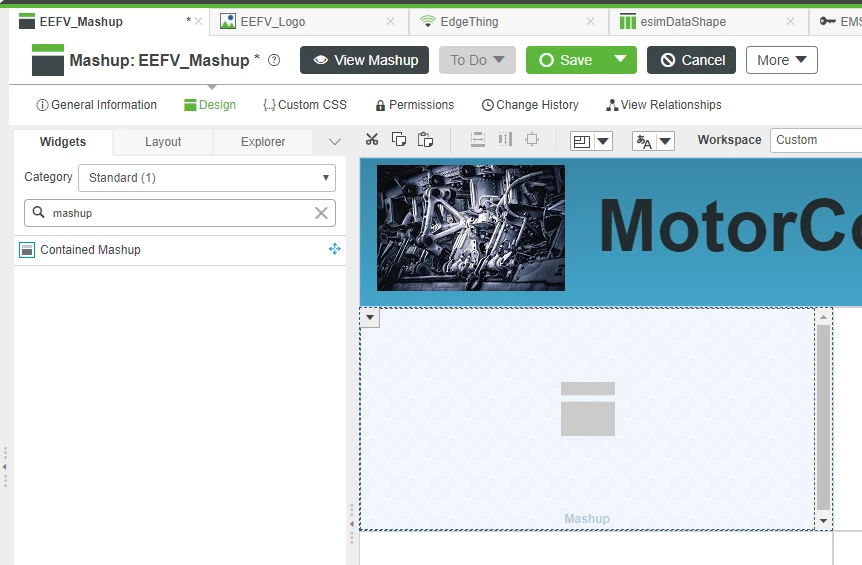
3. With the Contained Mashup Widget selected, return to the Properties tab in the bottom-left.
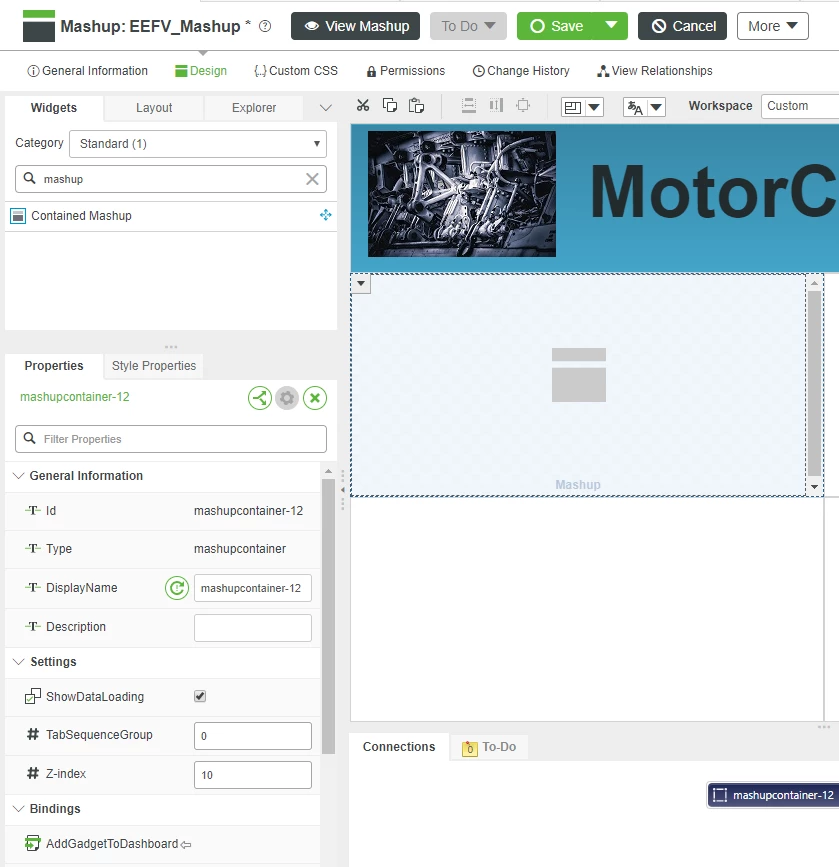
4. Scroll down and locate the Name Property.
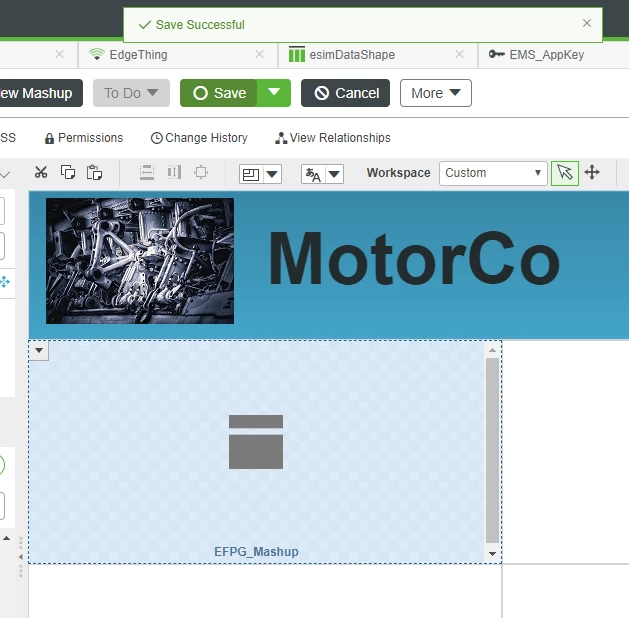
5. Search for and select EFPG_Mashup
6. Click Save.
Add Column Labels
The original Mashup we created (and have now embedded in the new one) had some labels for the inputs and outputs. However, you had to know what things like “s1_fb1” meant to understand that that was an input.
We can go back to the original EPFG_Mashup, make some modifications for greater clarity, and those changes will also carry over to our new Mashup.
1. Reopen the old EPFG_Mashup on the Design tab.
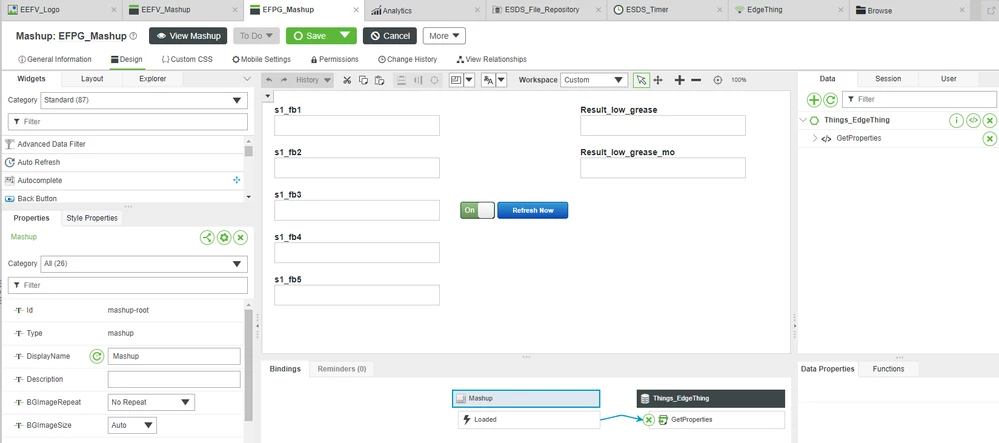
2. Move all of the Widgets down to leave some extra room at the top.
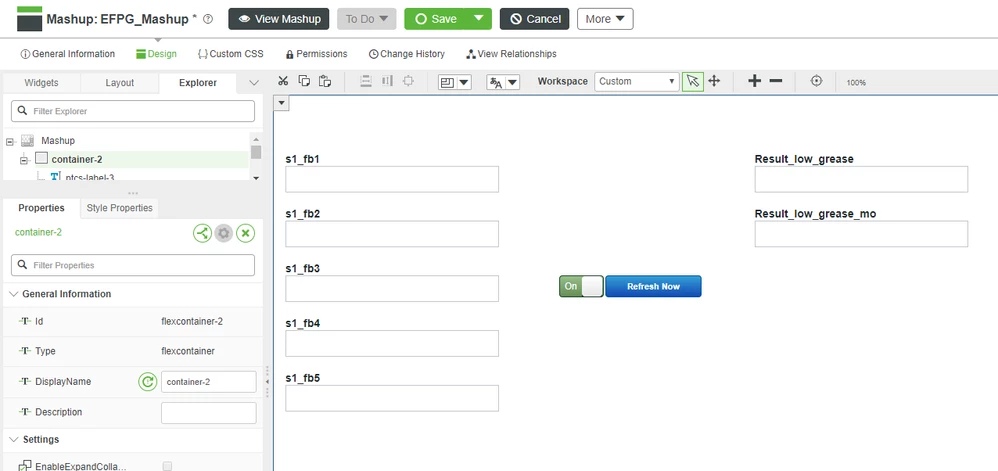
3. Drag-and-drop two Divider Widgets onto the Canvas above both the Inputs and Results columns.
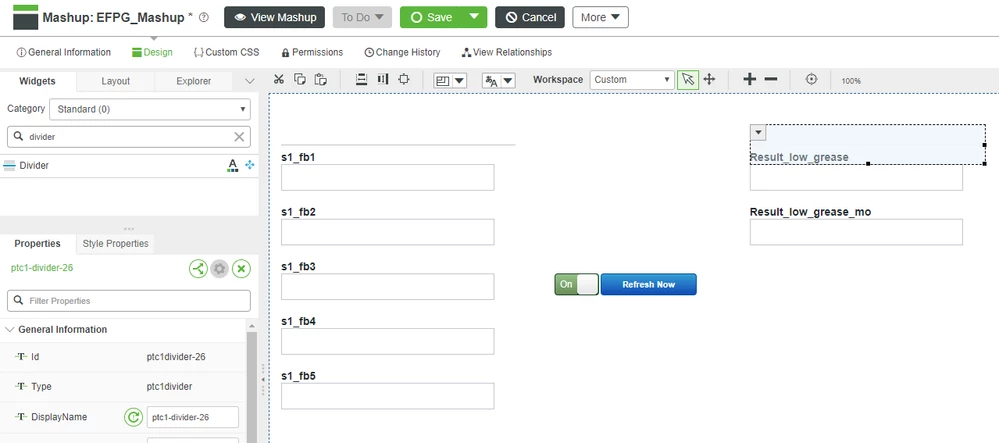
4. Select a Divider Widget, and go to its Style Properties.
5. Expand Base > Line to reveal the background Style Property.
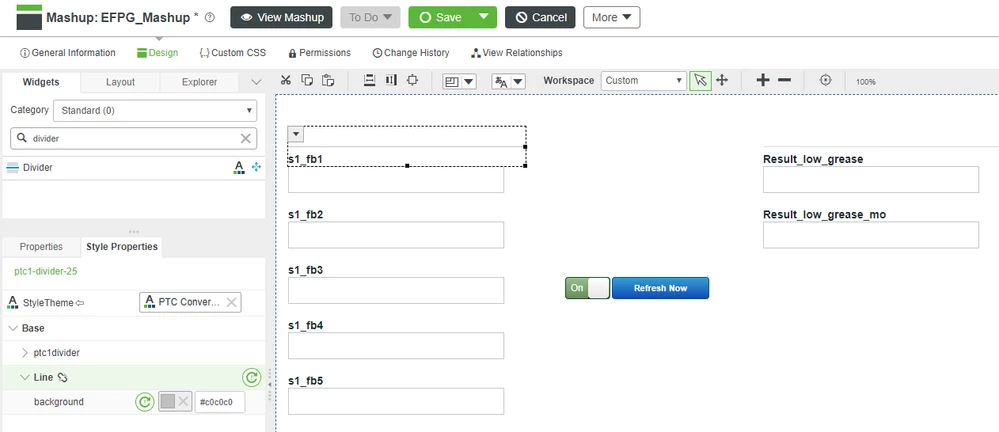
6. Click on the default gray color to see the available options.
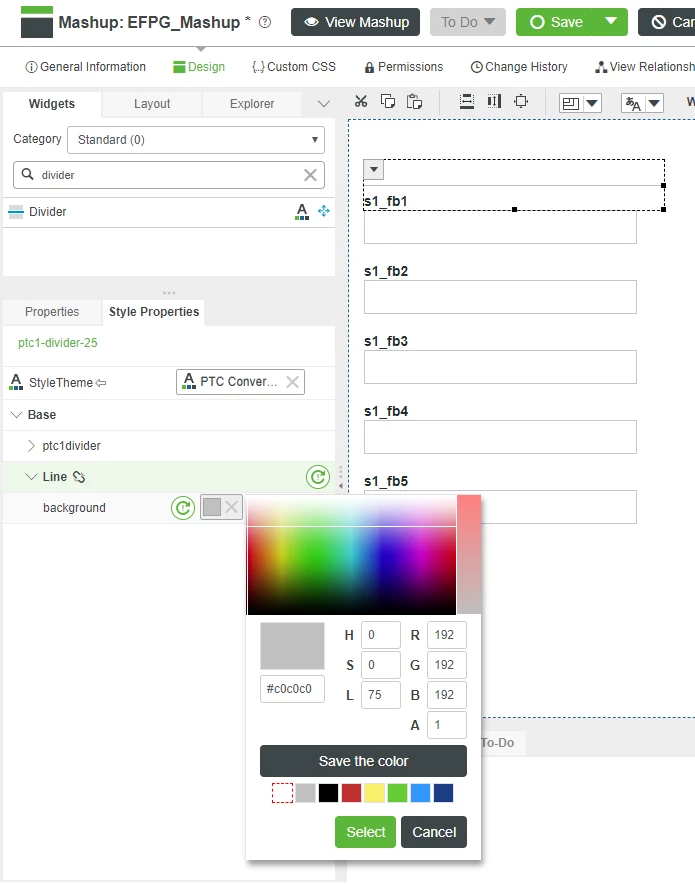
7. Choose the built-in black at the bottom, and click Select.
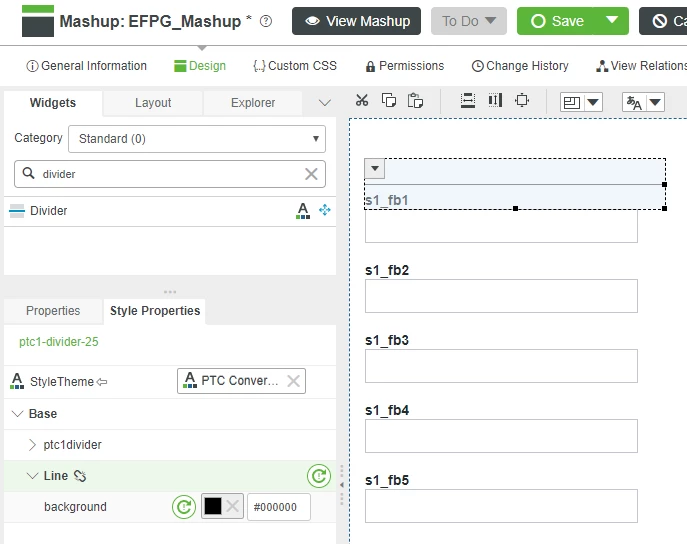
8. Make the same modification to the other Divider Widget.
9. Drag-and-drop two more Label Widgets onto the Canvas above the two columns.
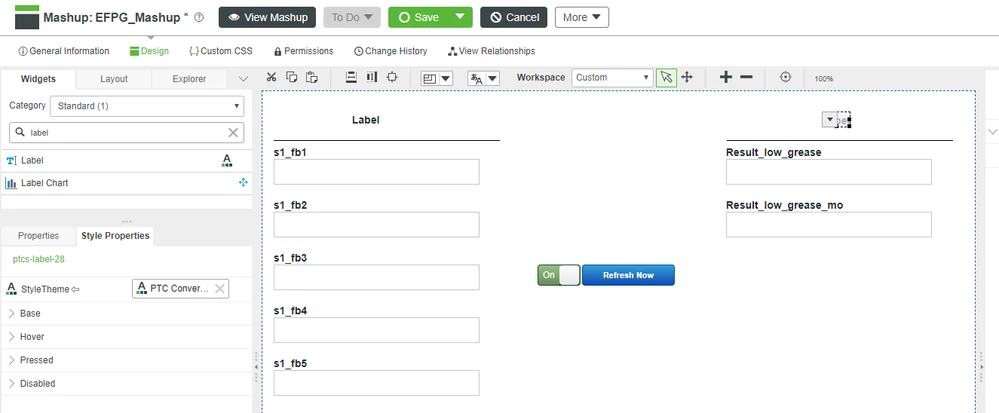
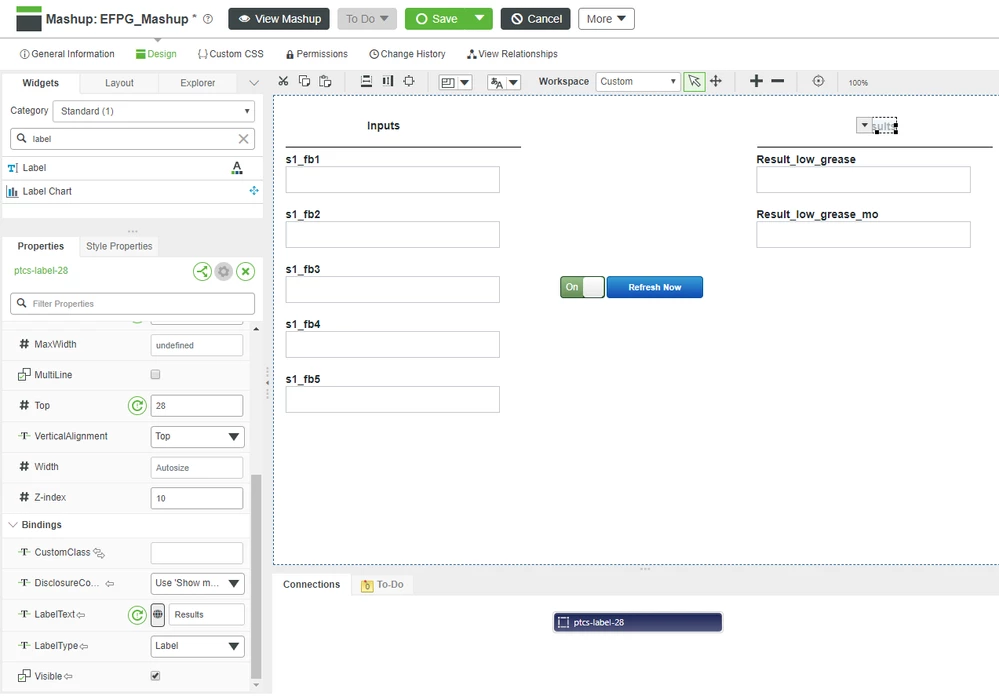
10. Change their LabelText Properties to Inputs and Results, respectively.
Change Background and Size
1. From the Explorer tab in the top-left, select the container.
2. Select the Style Properties tab in the bottom-left and expand Base > Container.
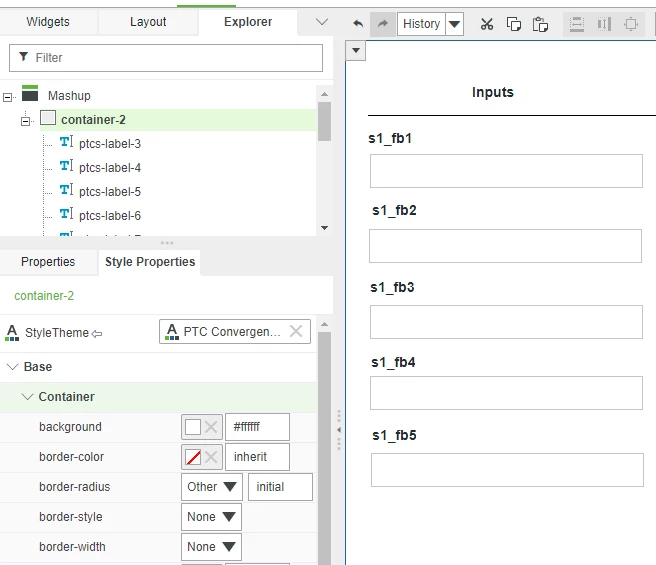
3. Change the background Style Property to a color you prefer.
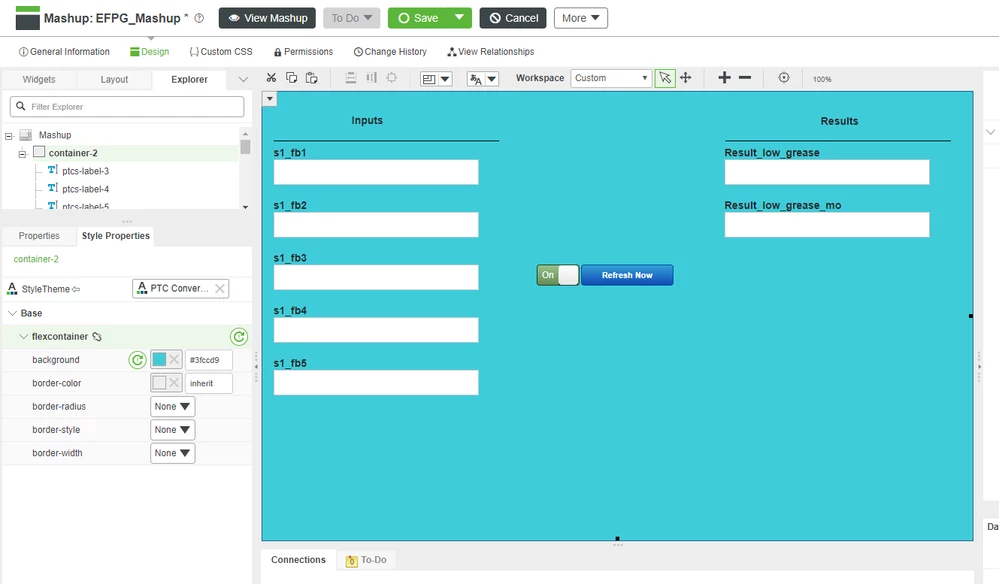
4. With the container still selected in the Explorer tab, drag the corners of the Mashup to reduce its size.
5. You could even move the Results column over, place the Auto Refresh Widget underneath, and then reduce the container size even further.
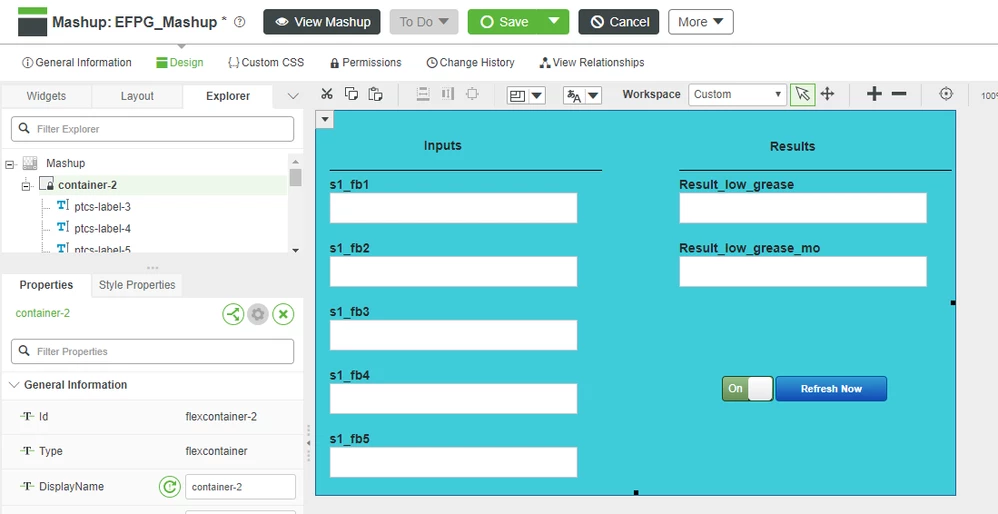
6. Click Save.
View Mashup Thus Far
With the changes to the previous EFPG_Mashup now complete, let’s ensure that everything carried over to our new Mashup.
1. Return to EEFV_Mashup.
2. Click Save.
3. Click View Mashup.
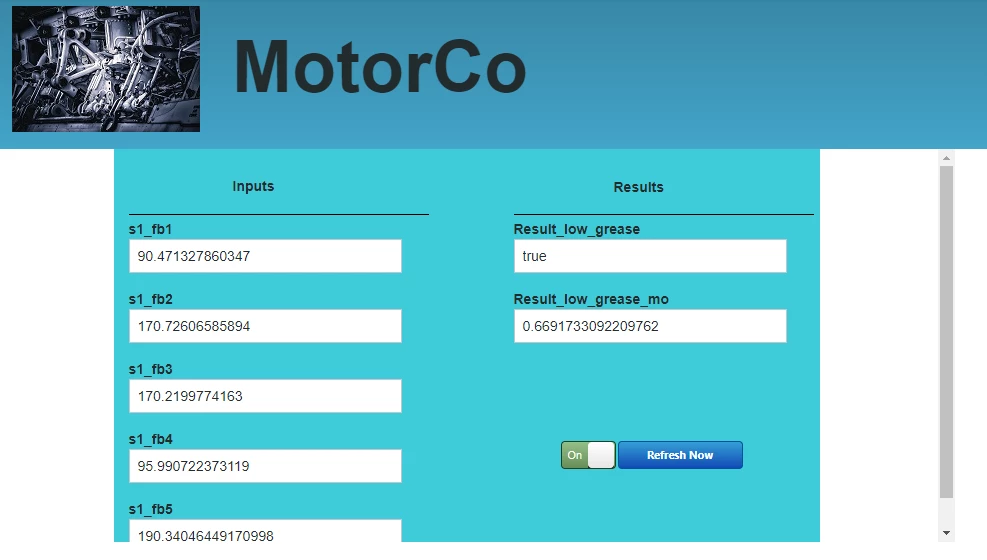
Note how the various changes we made to the base Mashup are also being shown, via a Contained Mashup Widget, in our new Mashup.
Splitting out functionality to a separate Mashup that is then embedded where needed is a great way to re-use content and simplify development.
Step 6: Add Chart
Our original Mashup (which has now been embedded in our new one) shows the instantaneous analytical results based on the inputs coming from the Edge MicroServer (EMS).
However, when investigating remote customer issues, it might be helpful to see some historical trends. A temporary "blip" of a low-grease indication might be worrisome, but it may not require immediate intervention unless the issue was occuring consistently or for extended periods of time.
Fortunately, creating a historical record is relatively simple in ThingWorx Foundation.
All that is really needed is a place in which to store the past records.
One of the easiest such storage methods is a Value Stream.
1. In ThingWorx Foundation, click Browse > Data Storage > Value Streams.
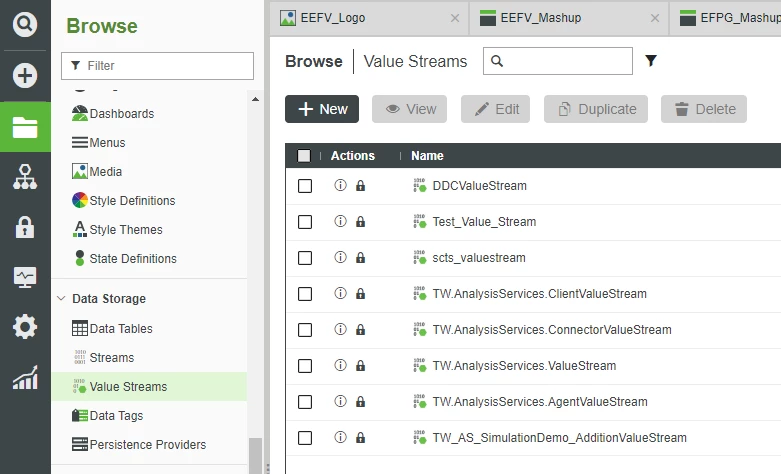
2. Click + New.
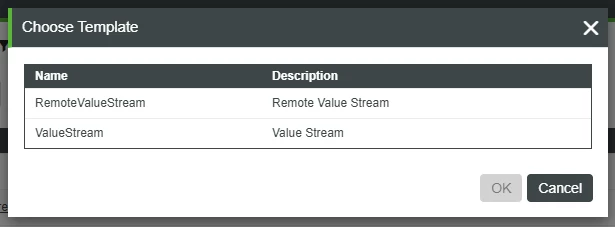
3. On the Choose Template pop-up, select ValueStream and click OK.
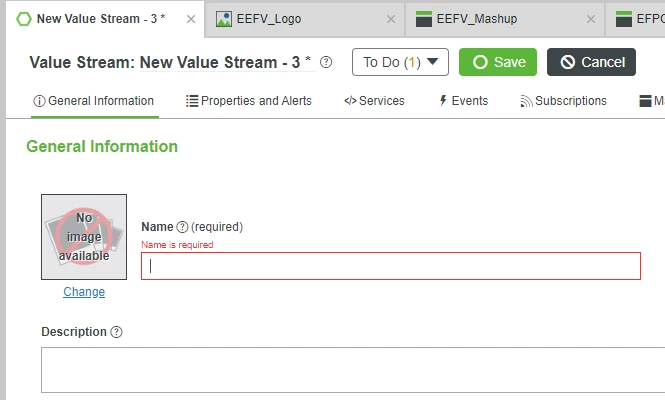
4. In the Name field, type EEFV_ValueStream.
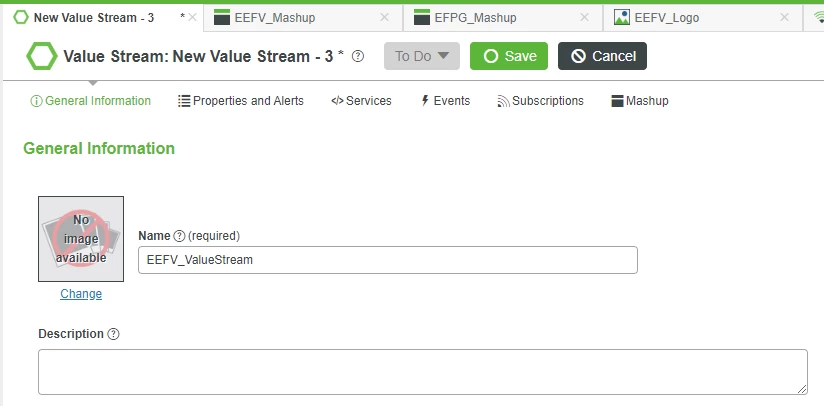
5. If Project is not already set, search for and select PTCDefaultProject.
6. At the top, click Save.
Link Value Stream and Begin Storage
Now that we have a Value Stream to act as a storage location, we want to link it to EdgeThing.
After EdgeThing knows where to store historical data, we can simply instruct it which Property we want to archive by setting it to Logged.
1. Return to EdgeThing and its General Information tab.
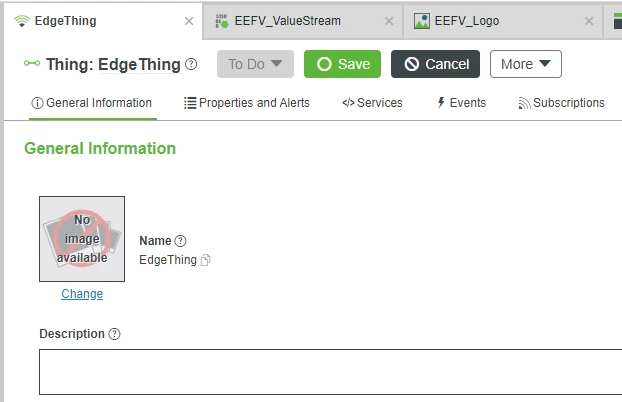
2. In the Value Stream field, search for and select EEFV_ValueStream.
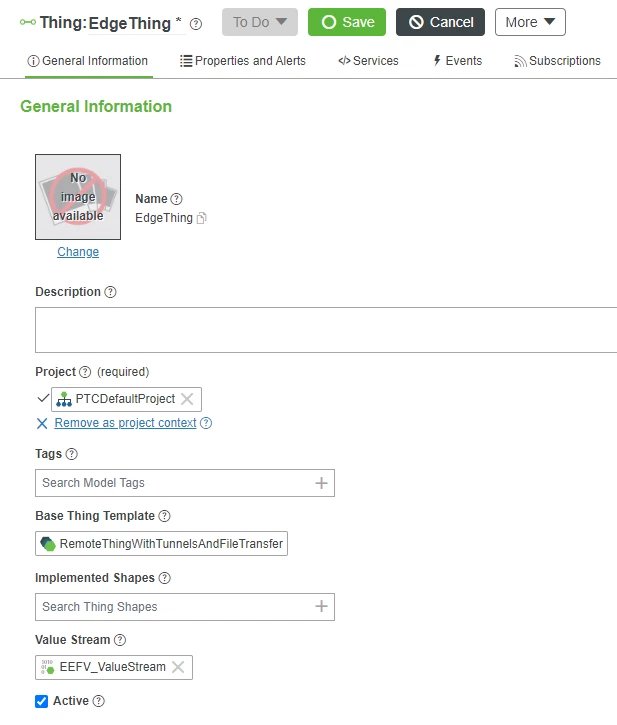
3. Click Save.
4. Still on EdgeThing, click Properties and Alerts.
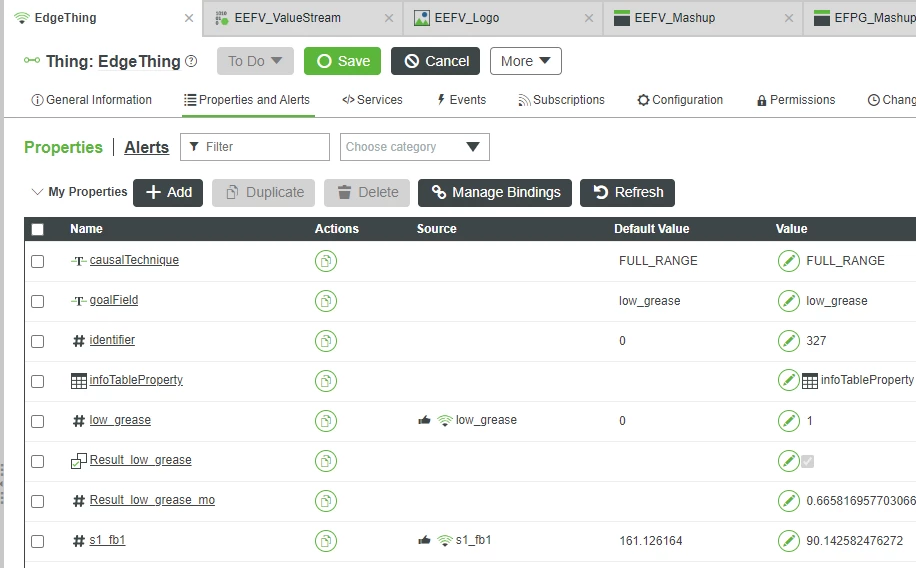
5. Click Result_low_grease_mo to trigger the slide-out from the right-side.
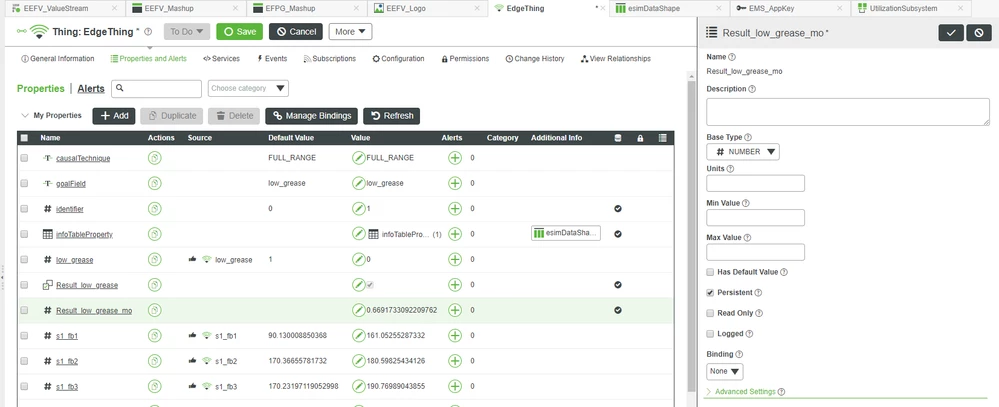
6. Check Logged.
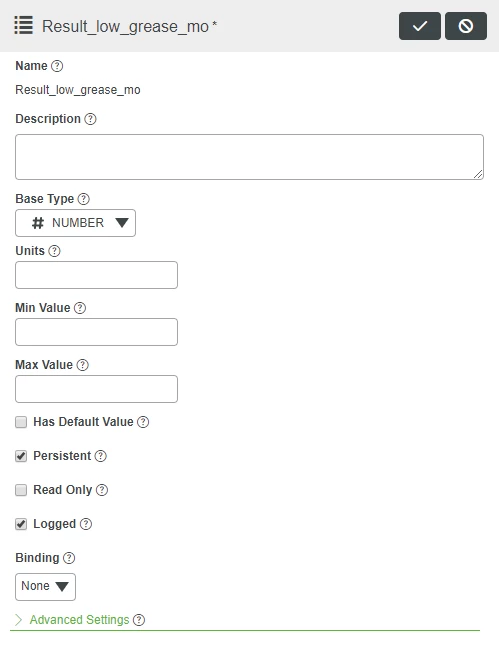
7. Click the Check icon in the top-right to close the slide-out.
8. Click Save.
Add Line Chart and Data
As per most guides in this Learning Path, it is assumed that you have an active connection to the EMS Engine Simulator and have your Analytics Event currently set to active.
This provides both the engine-sensor inputs and the analytical results for our Mashup.
After adding the Value Stream above, you'll need to let it run for a bit for the historical data to be archived. After it's run for a while and we have a valid history build-up, you can display that history in a Line Chart.
1. Return to EEFV_Mashup on the Design tab.
2. Click on the top-right section to select it.
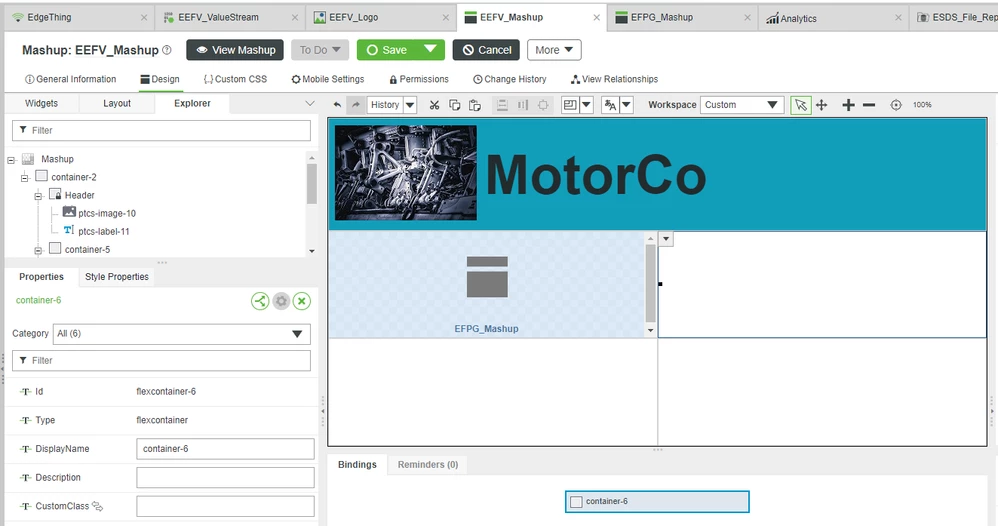
3. From the Widgets tab, drag-and-drop a Line Chart onto the top-right section.
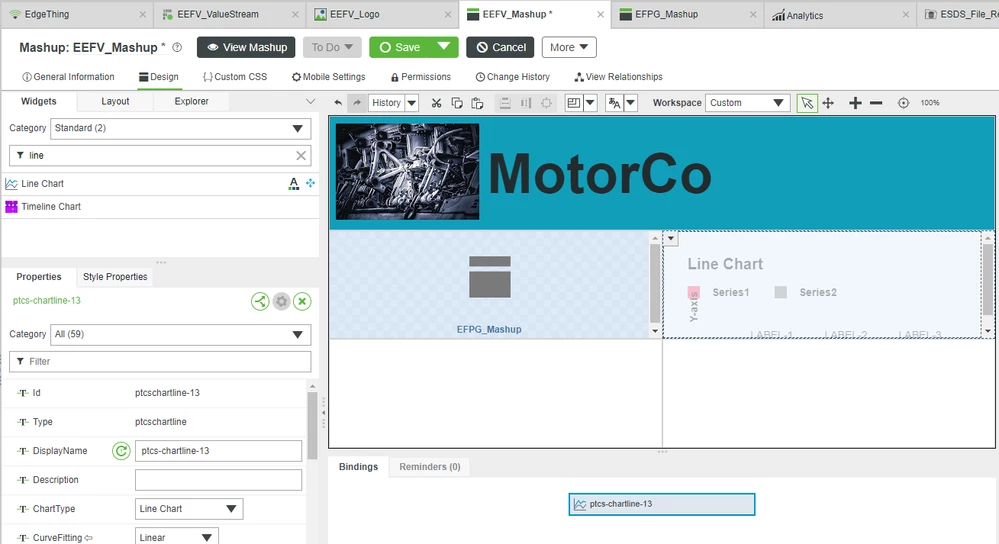
4. In the top-right of Mashup Builder, ensure the Data tab is selected.

5. Click the green + button.
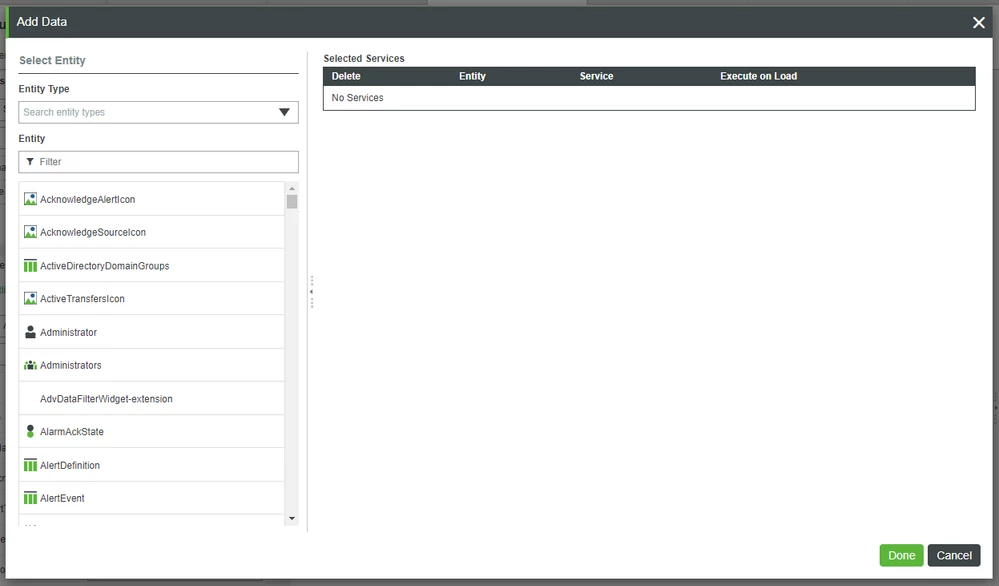
6. On the Add Data pop-up in Entity Filter, search for and select EdgeThing.
7. In Services Filter, type queryprop.
8. Click the right arrow button besides QueryPropertyHistory.
9. Check Execute on Load.
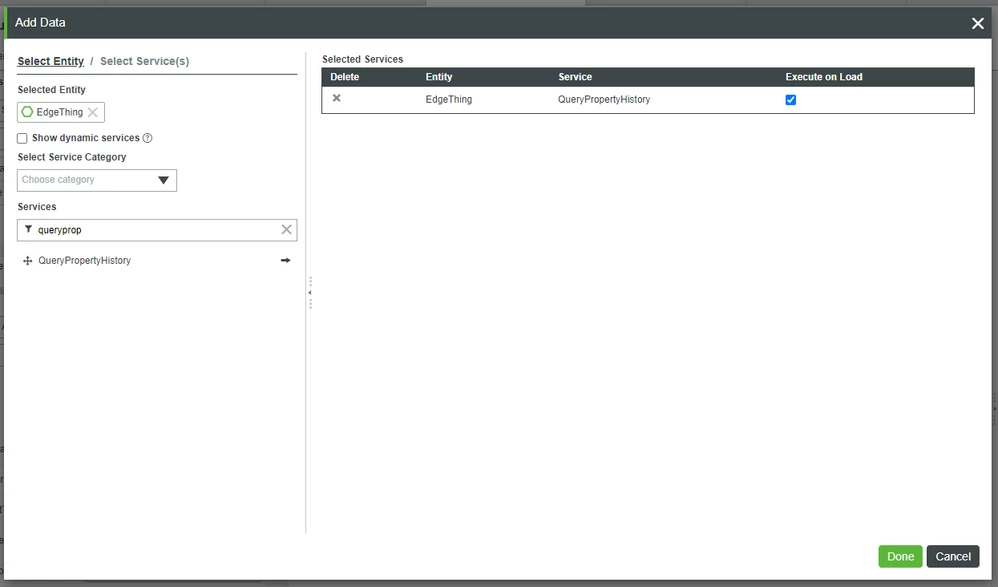
10. Click Done.
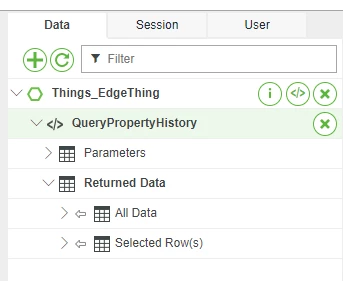
11. Expand Data > Things_EdgeThing > QueryPropertyHistory > Returned Data.
Bind Data and View Mashup
Now that we have both our method of displaying the historical data, i.e. a Line Chart, as well as a method to bring backend data into the Mashup, i.e. QueryPropertyHistory, we can bind them together and see how our Mashup is progressing.
1. From the right under the Data tab, drag-and-drop EdgeThing > QueryPropertyHistory > Returned Data > All Data onto the Line Chart in the top-right of the Canvas.
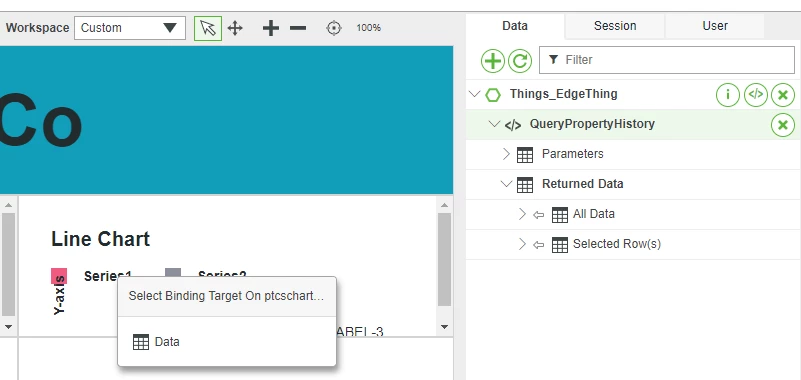
2. On the Select Binding Target pop-up, click Data.
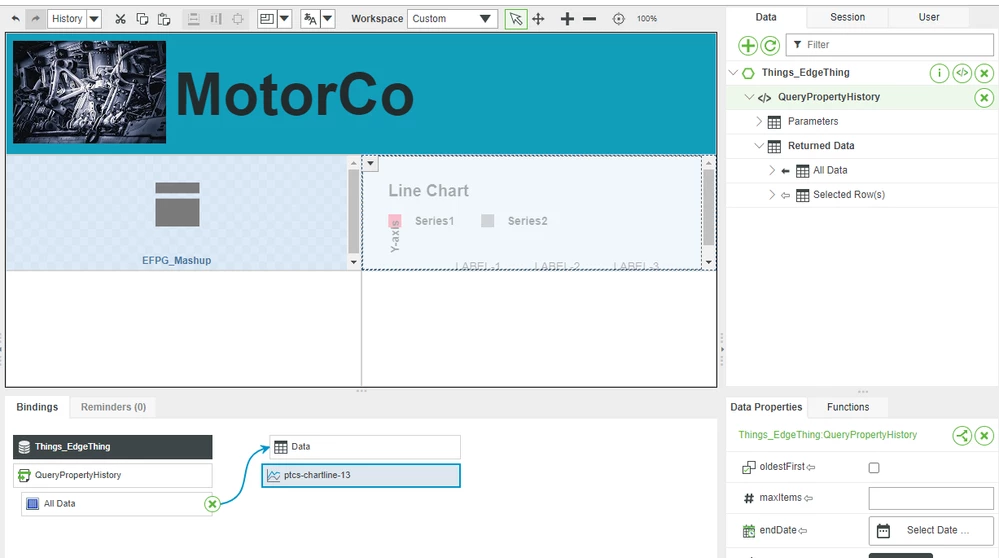
3. With the Line Chart selected, explore its Properties in the bottom-left.
4. Change XAxisField to timestamp.
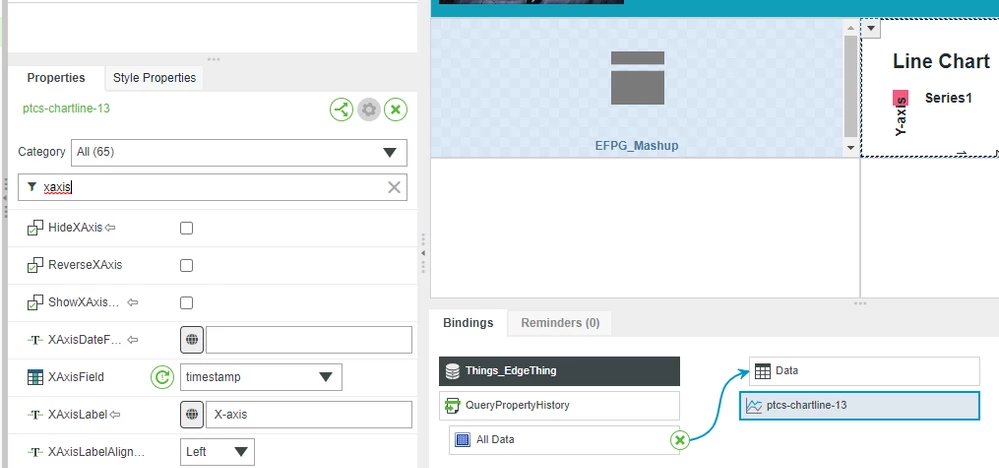
5. Click Save.
6. Click View Mashup.

Your own Line Chart will vary depending on what values your Engine Simulator is sending to Foundation and Analytics.
NOTE: Remember that the Analysis Event needs to be Enabled for new values to be fed into Result_low_grease_mo.
Click here to view Part 3 of this guide.

