- Community
- IoT & Connectivity
- IoT & Connectivity Tips
- Enhanced Engine Failure Visualization Part 3
- Subscribe to RSS Feed
- Mark as New
- Mark as Read
- Bookmark
- Subscribe
- Printer Friendly Page
- Notify Moderator
Enhanced Engine Failure Visualization Part 3
Step 7: Add Grid
It might also be helpful to display the data you've used to build the ThingWorx Analytics model.
In the future, this might be split out into an entirely separate page/Mashup that is exclusively devoted to backend model creation, but that would be beyond the scope of this guide.
For now, we'll simply display that collected data via the Grid Widget
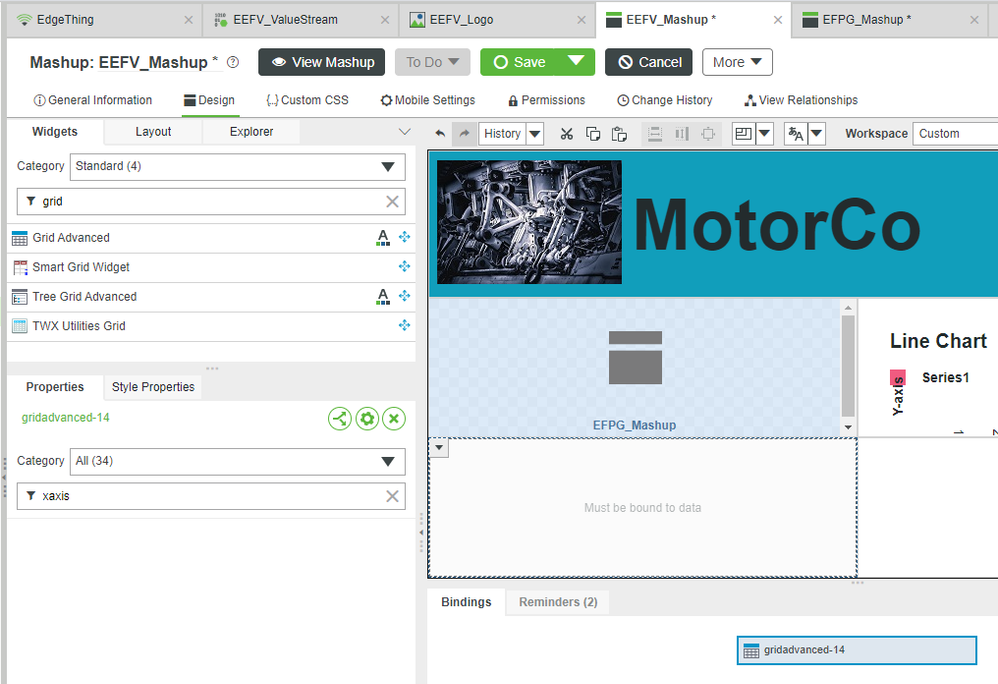
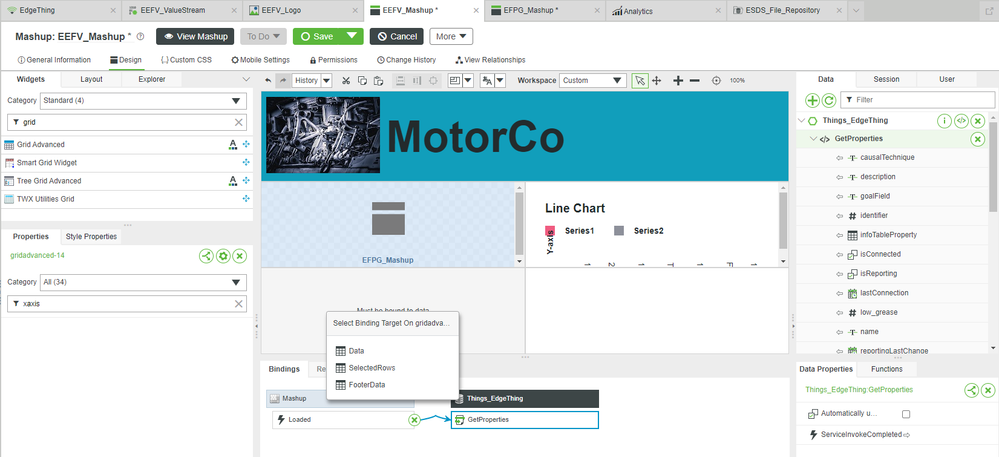
1. On the EEFV_Mashup, drag-and-drop a Grid Advanced Widget onto the bottom-left Canvas section..
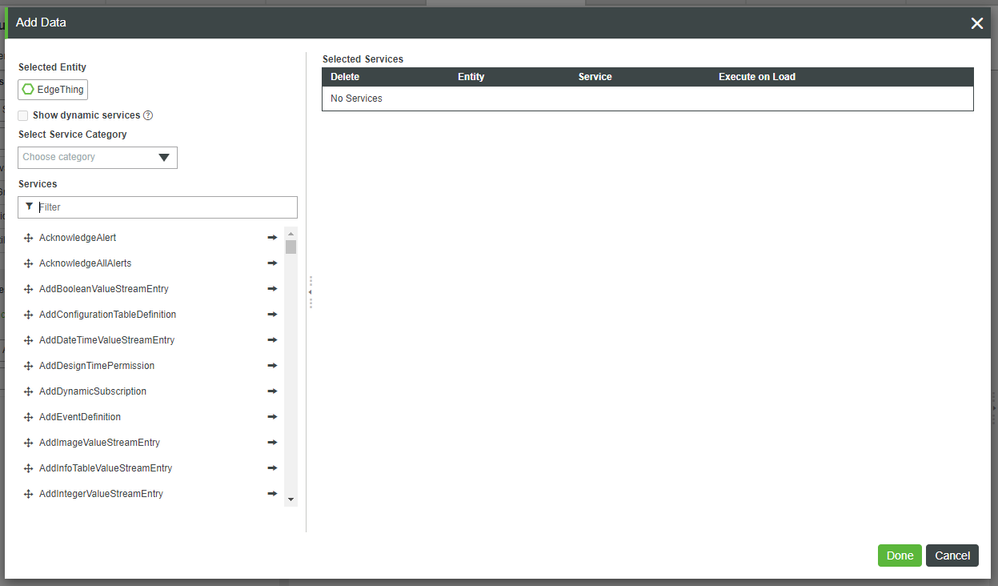
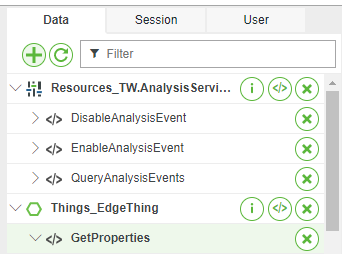
2. On the top-right Data tab, click the green </> button beside Things_EdgeThing.
- Note that this will open the Add Data pop-up, but with EdgeThing pre-selected.
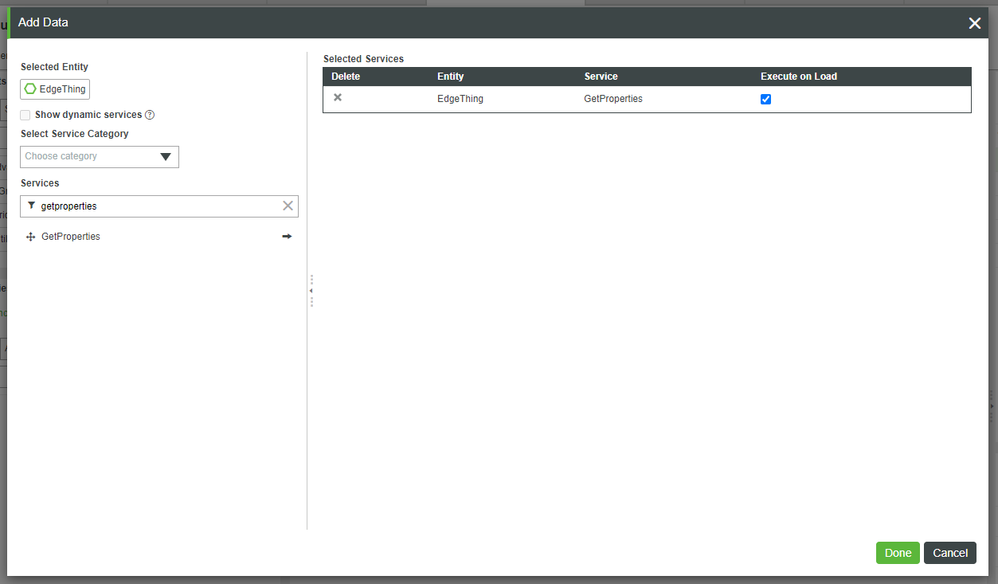
3. In the Services Filter field, type getproperties.
4. Click the right-arrow beside GetProperties to add it to Selected Services on the right.
5. Check Execute on Load.
6. Click Done.
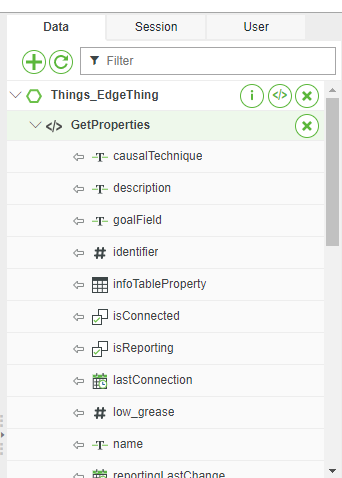
7. Under the Data tab, expand GetProperties to reveal the options.
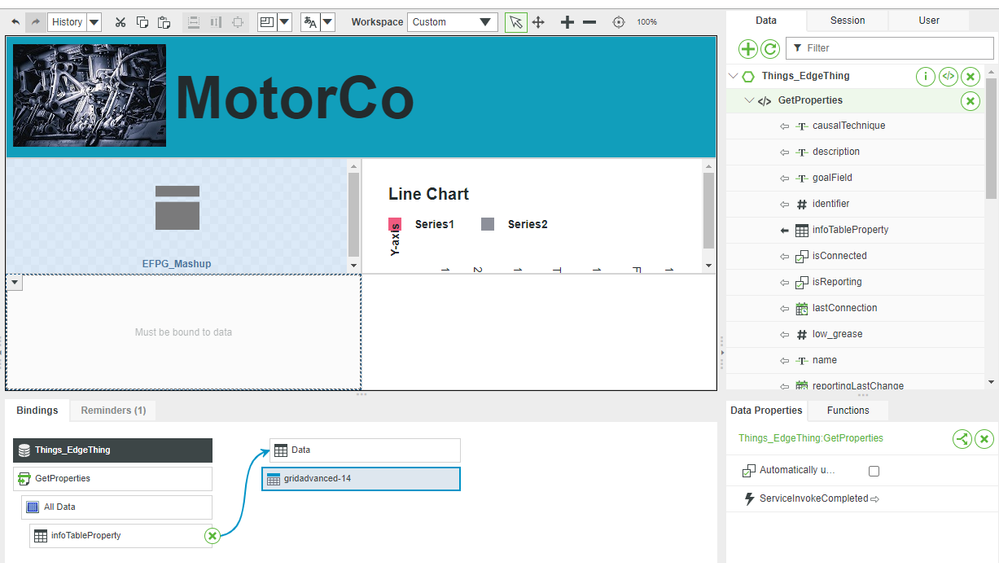
8. Drag-and-drop Things_EdgeThing > GetProperties > infoTableProperty onto the Grid Advanced Widget.
9. On the Select Binding Target pop-up, click Data.
10. Click Save.
11. Click View Mashup.
Step 8: Add Controls
Throughout this Learning Path, it has been recommended that you stop Analysis Events when not actively using their functionality.
However, this requires going into the backend of ThingWorx Analytics to disable the event, which is not ideal.
Instead, let's enable or disable the Analysis Event from inside the Mashup by adding some Button Widgets to directly interface the Analytics backend for us.
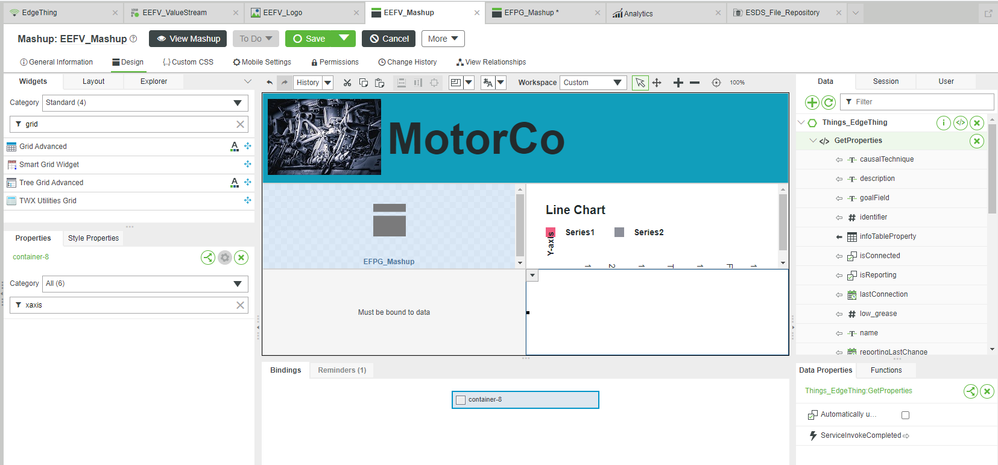
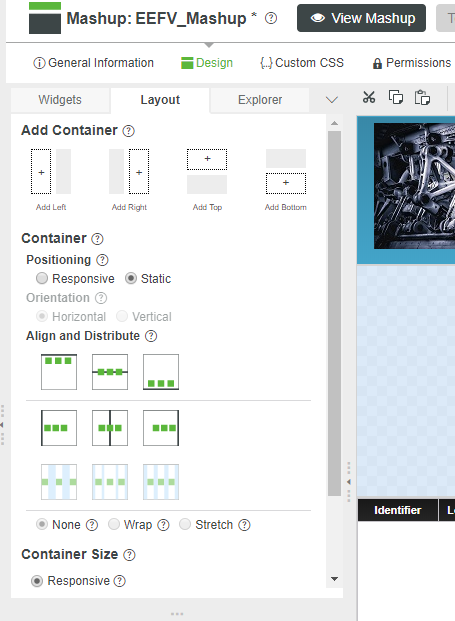
1. Click the bottom-right Canvas section to select it.
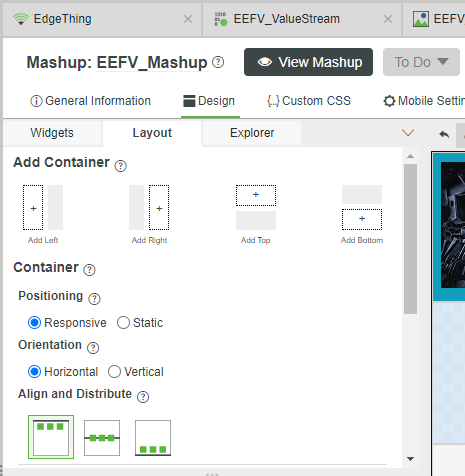
2. In Mashup Builder top-left, click the Layout tab.
3. Under Positioning, click the Static radio-button.
4. Click the Widgets tab.
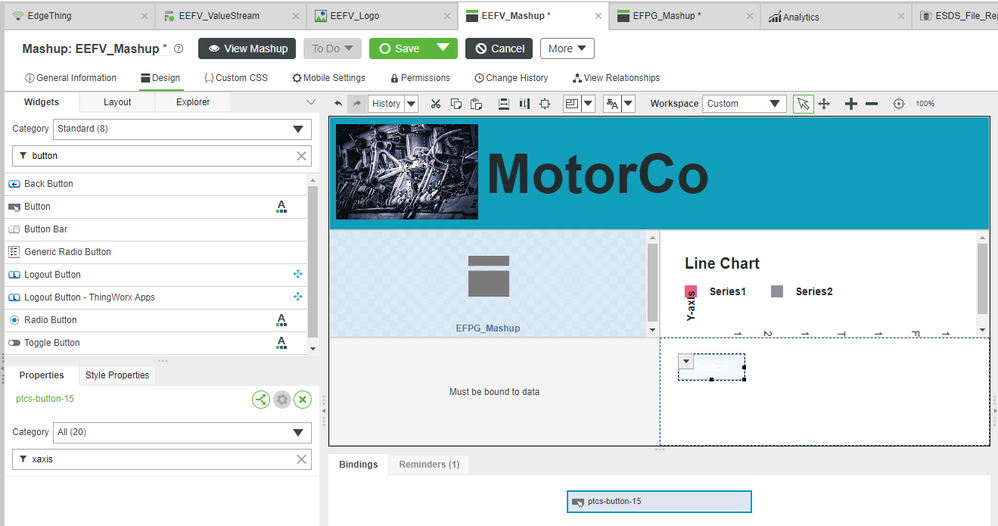
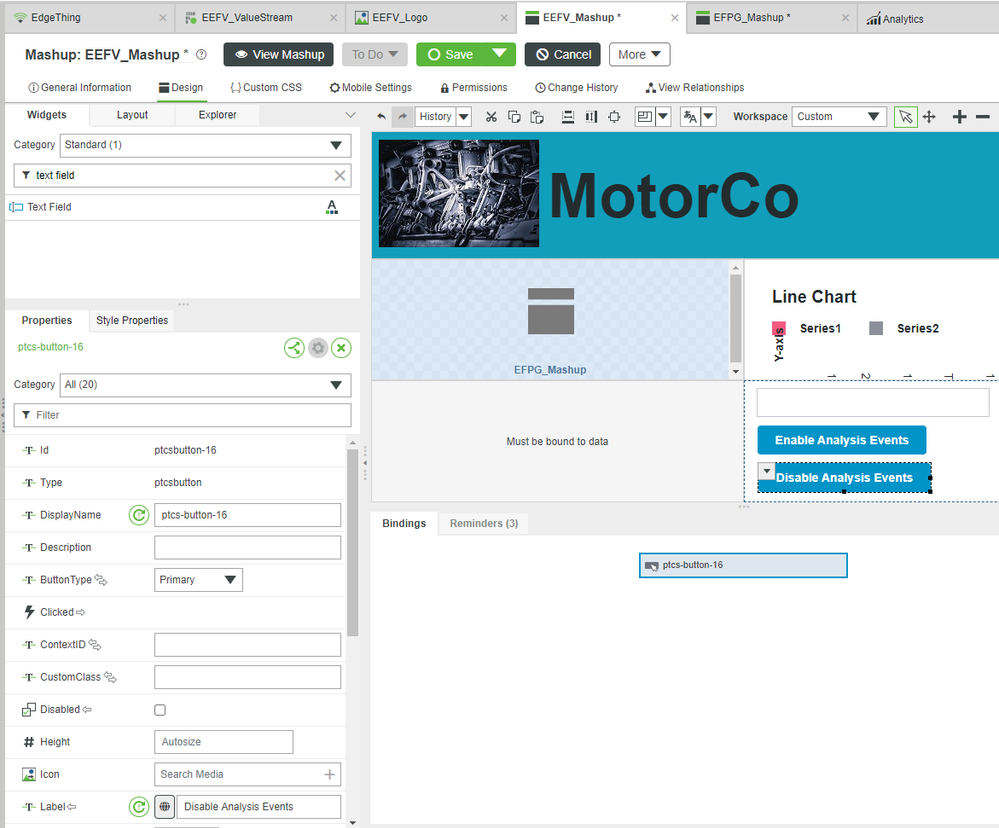
5. Drag-and-drop a Button Widget onto the bottom-right section.
6. Drag-and-drop another Button Widget onto the bottom-right section.
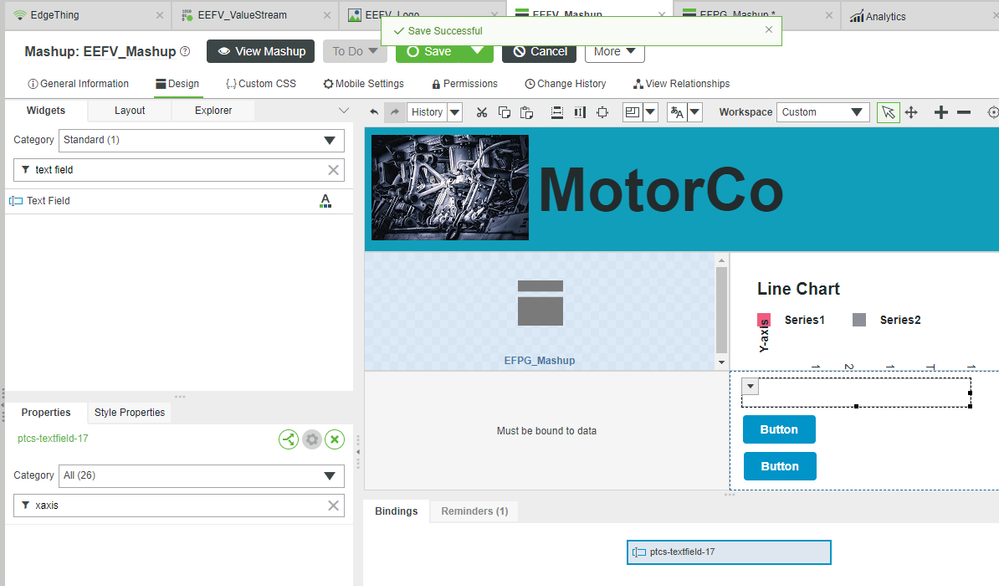
7. Drag-and-drop a Text Field Widget onto the bottom-right section.
8. Click Save.
Bring in More Data
Now that we have Buttons to trigger enable/disable, as well as a Text Field to display information,
we now need to bring in some additional Mashup Data Services to interact with the ThingWorx Analytics backend.
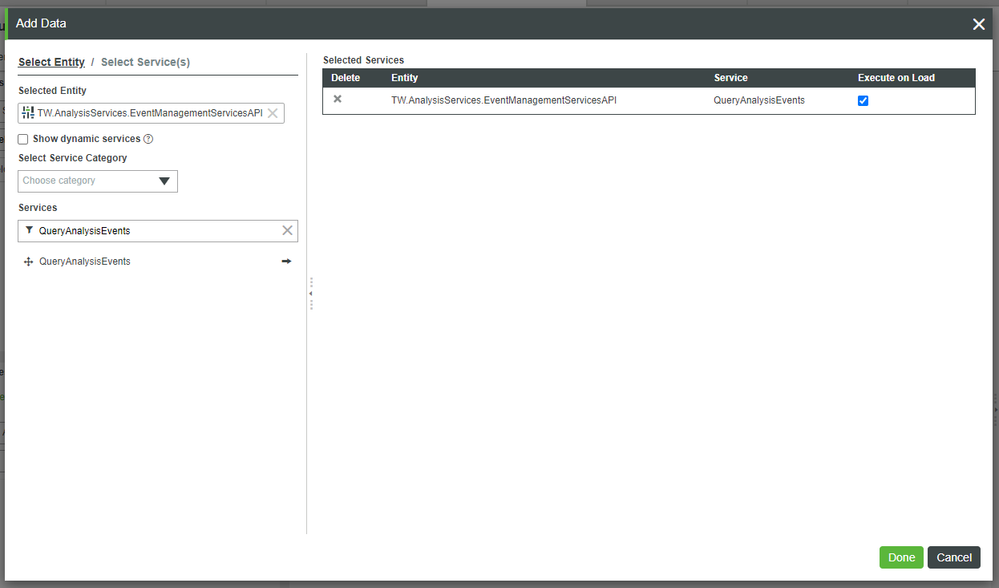
1. Click the green + button at the top of the Data tab.
2. In the Entity Filter field, search for and select TW.AnalysisServices.EventManagementServicesAPI.
3. In the Services Filter field, search for and add QueryAnalysisEvents by clicking the right arrow.
4. Check Execute on Load.
5. In Services Filter, search for and select EnableAnalysisEvent by clicking the right arrow.
- Note that you should NOT check "Execute on Load", as we'll trigger this Service only when the Button is clicked.
6. In Services Filter, search for and select DisableAnalysisEvent by clicking the right arrow.
- Likewise, do NOT check "Execute on Load" here either.
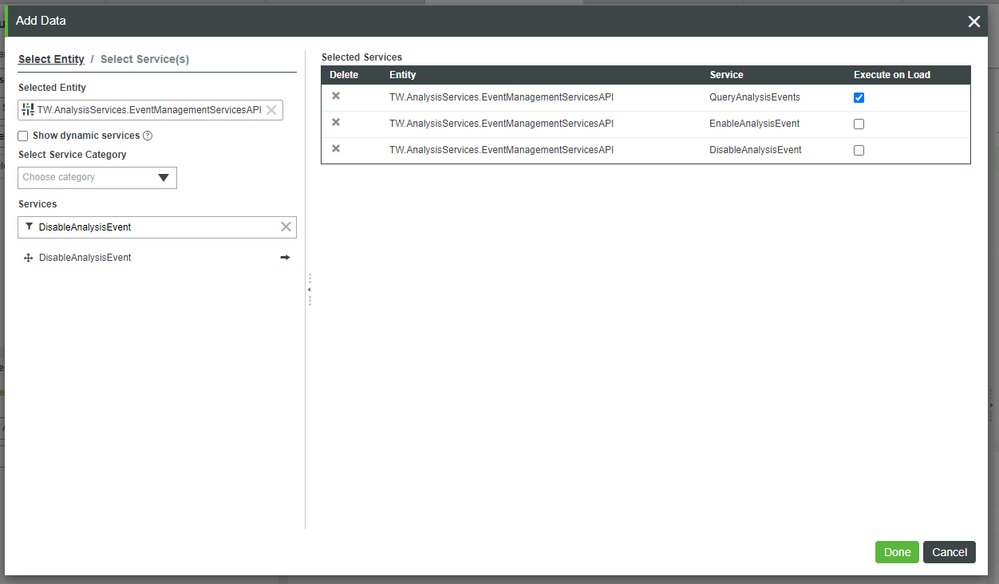
7. Click Done.
8. Click Save.
Display Event Key
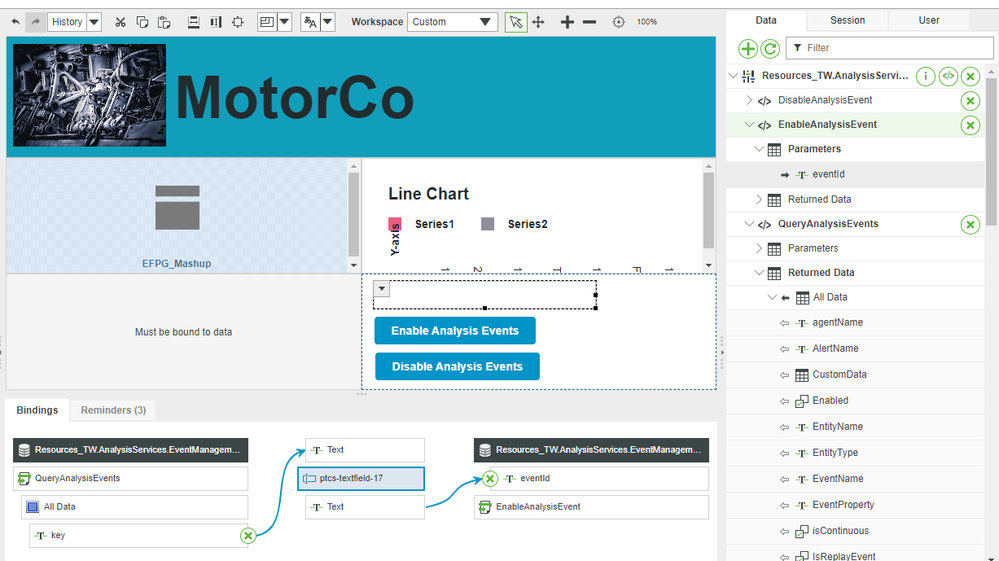
To enable or disable Analytics Events, we need to know the eventId, which is returned by QueryAnalysisEvent Service as the parameter labeled key.
We'll bind that to the Text Field Widget for later usage in enabling/disabling.
1. Change the top-button's Label Property to Enable Analytics Event.
2. Change the bottom-button's Label Property to Disable Analytics Event.
3. Under the Data tab, expand QueryAnalysisEvents > Returned Data > All Data to reveal the options.
.
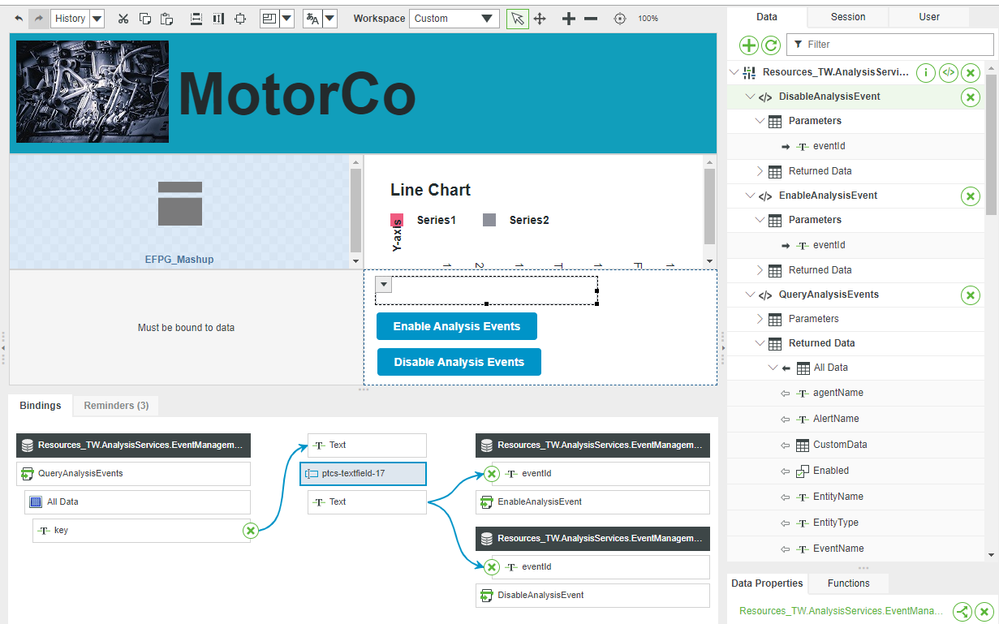
4. Drag-and-drop QueryAnalysisEvents > Returned Data > All Data > key to the TextField Widget.
5. On the Select Binding Target pop-up, click Text.
6. Click Save.
Enable/Disable Analytics Events
Now that we know the key/eventId, we can call the EnableAnalysisEvent and DisableAnalysisEvent services.
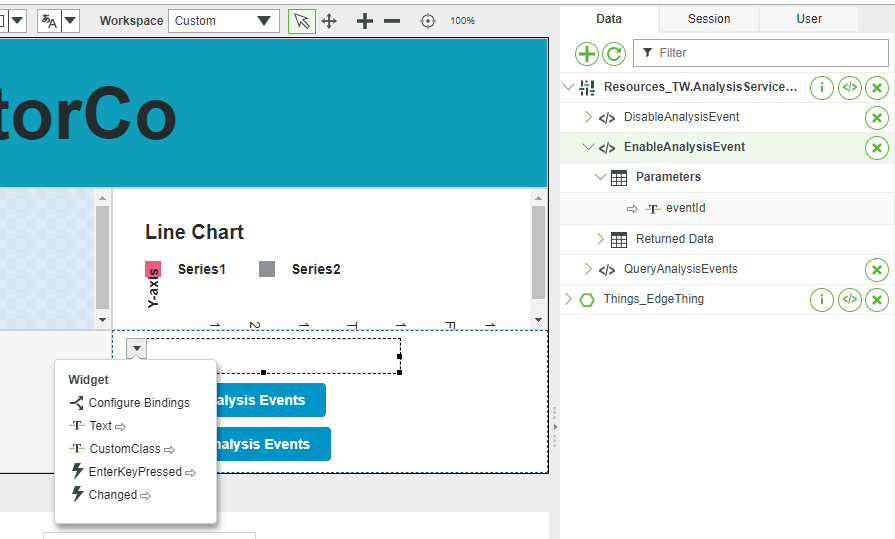
1. Under the Data tab, expand EnableAnalysisEvent > Parameters to reveal eventId.
2. Click the Text Field Widget to select it, and then click the top-left drop down to reveal the options.
3. Drag-and-drop the Text Field's Text Property onto EnableAnalysisEvent > Parameters > eventId.
4. Repeat steps 1-3 for DisableAnalysisEvent.
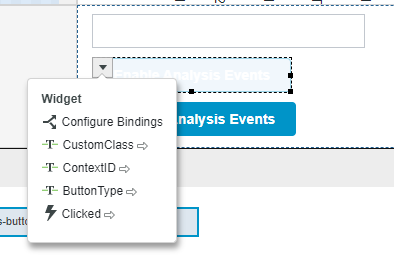
5. Click the Enable Analytics Event Button Widget to select it, then click the top-left to reveal the drop down option
.
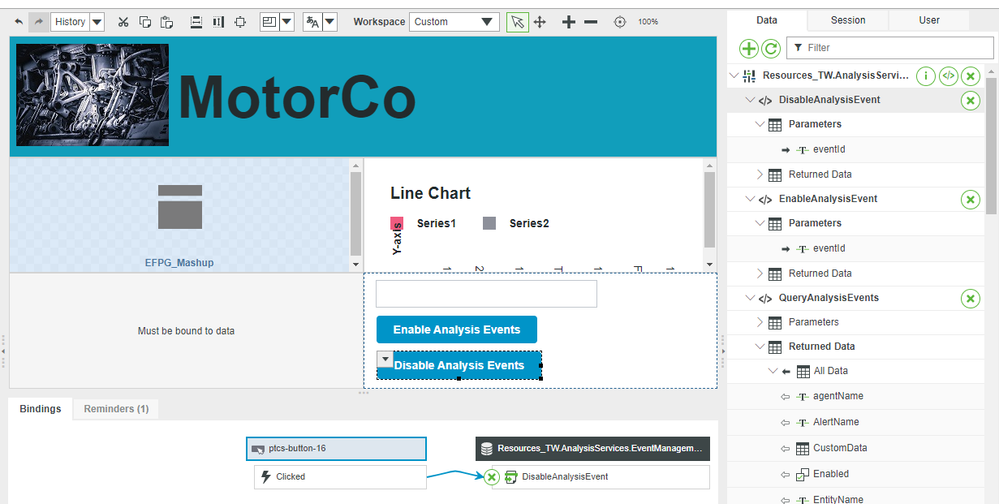
6. Drag-and-drop the Clicked Event onto the EnableAnalysisEvent Service under the Data tab.
7. Repeat steps 5-6 for DisableAnalysisEvent, using the other Button Widget.
8. Click Save
Step 9: View Mashup
Throughout this guide, we've added various additional functionality to our MVP Mashup. At this point, you could continue to update the Mashup as you see fit.
For instance, you could change the background color of the top-left section to better match the header. Or you could further modify the original Mashup shown in the Contained Mashup Widget so that it better fits in the allowed space. You could add another Label Widget to the Header section to also display the company's motto / tag-line.
Regardless, when you are done with modifications, Save and click View Mashup.

Note that you can left-click-and-drag on the Time Series Chart to select particular time ranges. Or you could add a Time Selector Widget to the bottom-right section to control it there.
Similarly, you could add controls for the Grid Widget to only show the Identifier ranges in which you were interested.
Or you could split out the Model-creation values to a completely separate Mashup as previously discussed.
The extent to which you develop your Mashup is entirely up to you.
Step 10: Next Steps
Congratulations. You've completed the Enhanced Engine Failure Visualization guide.
In this guide, you learned how to:
- Create a Mashup with a Header
- Divide your Mashup into Sub-sections
- Use a Contained Mashup to reuse development
- Store historical data in a Value Steam
- Display historical data in a Line Chart
- Show spreadsheet data via a Grid Advanced Widget
- Tie Mashup controls into the ThingWorx backend
This is the last guide in the Vehicle Predictive Pre-Failure Detection with ThingWorx Platform learning path.
Learn More
We recommend the following resources to continue your learning experience:
| Capability | Guide |
| Build | Implement Services, Events, and Subscriptions Guide |
Additional Resources
If you have questions, issues, or need additional information, refer to:
| Resource | Link |
| Community | Developer Community Forum |
| Support | Analytics Manager Help Center |

