Community Tip - You can change your system assigned username to something more personal in your community settings. X
- Subscribe to RSS Feed
- Mark as New
- Mark as Read
- Bookmark
- Subscribe
- Printer Friendly Page
- Notify Moderator
Load Testing through C SDK Remote Device Simulation in ThingWorx
Load Testing through C SDK
Remote Device Simulation in ThingWorx
As discussed in the EDC's previous article, load or stress testing a ThingWorx application is very important to the application development process and comes highly recommended by PTC best practices. This article will show how to do stress testing using the ThingWorx C SDK at the Edge side. Attached to this article is a download containing a generic C SDK application and accompanying simulator software written in python. This article will discuss how to unpack everything and move it to the right location on a Linux machine (Ubuntu 16.04 was used in this tutorial and sudo privileges will be necessary). To make this a true test of the Edge software, modify the C SDK code provided or substitute in any custom code used in the Edge devices which connect to the actual application.
It is assumed that ThingWorx is already installed and configured correctly. Anaconda will be downloaded and installed as a part of this tutorial. Note that the simulator only logs at the "error" level on the SDK side, and the data log has been disabled entirely to save resources. For any questions on this tutorial, reach out to the author Desheng Xu from the EDC team (@DeShengXu).
Background:
Within ThingWorx, most things represent remote devices located at the Edge. These are pieces of physical equipment which are out in the field and which connect and transmit information to the ThingWorx Platform. Each remote device can have many properties, which can be bound to local properties. In the image below, the example property "Pressure" is bound to the local property "Pressure". The last column indicates whether the property value should be stored in a time series database when the value changes. Only "Pressure" and "TotalFlow" are stored in this way.
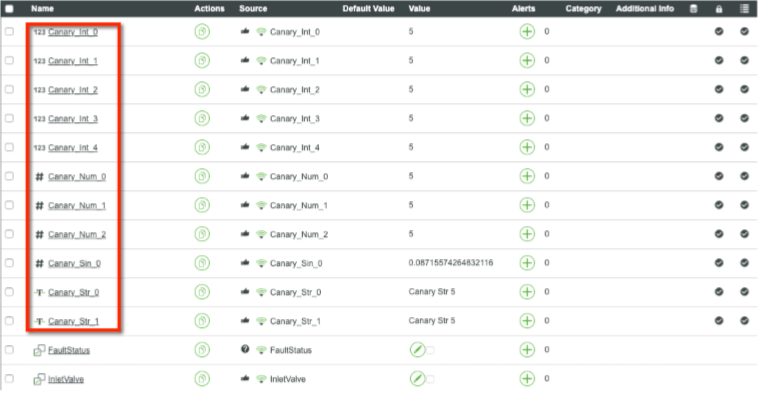
A good stress test will have many properties receiving updates simultaneously, so for this test, more properties will be added. An example shown here has 5 integers, 3 numbers, 2 strings, and 1 sin signal property.
Installation:
- Download Python 3 if it isn't already installed
- Download Anaconda version 5.2
Sometimes managing multiple Python environments is hard on Linux, especially in Ubuntu and when using an Azure VM. Anaconda is a very convenient way to manage it. Some commands which may help to download Anaconda are provided here, but this is not a comprehensive tutorial for Anaconda installation and configuration.- Download Anaconda
curl -O https://repo.anaconda.com/archive/Anaconda3-5.2.0-Linux-x86_64.sh - Install Anaconda (this may take 10+ minutes, depending on the hardware and network specifications)
bash Anaconda3-5.2.0-Linux-x86_64.sh - To activate the Anaconda installation, load the new PATH environment variable which was added by the Anaconda installer into the current shell session with the following command:
source ~/.bashrc - Create an environment for stress testing. Let's name this environment as "stress"
conda create -n stress python=3.7 - Activate "stress" environment every time you need to use simulator.py
source activate stress
- Download Anaconda
- Install the required Python modules
Certain modules are needed in the Python environment in order to run the simulator.py file: psutil, requests.
Use the following commands to install these (if using Anaconda as installed above):conda install -n stress -c anaconda psutil conda install -n stress -c anaconda requests - Unpack the download attached here called csim.zip
- Unzip csim.zip and move it into the /opt folder (if another folder is used, remember to change the page in the simulator.json file later)
- Assign your current user full access to this folder (this command assumes the current user is called ubuntu ) :
sudo chown -R ubuntu:ubuntu /opt/csim
- Unzip csim.zip and move it into the /opt folder (if another folder is used, remember to change the page in the simulator.json file later)
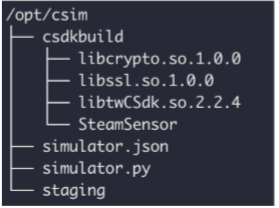
- Move the C SDK source folder to the lib folder
- Use the following command:
sudo mv /opt/csim/csdkbuild/libtwCSdk.so.2.2.4 /usr/lib - You may have to also grant a+x permissions to all files in this folder
- Use the following command:
- Update the configuration file for the simulator
- Open /opt/csim/simulator.json (or whatever path is used instead)
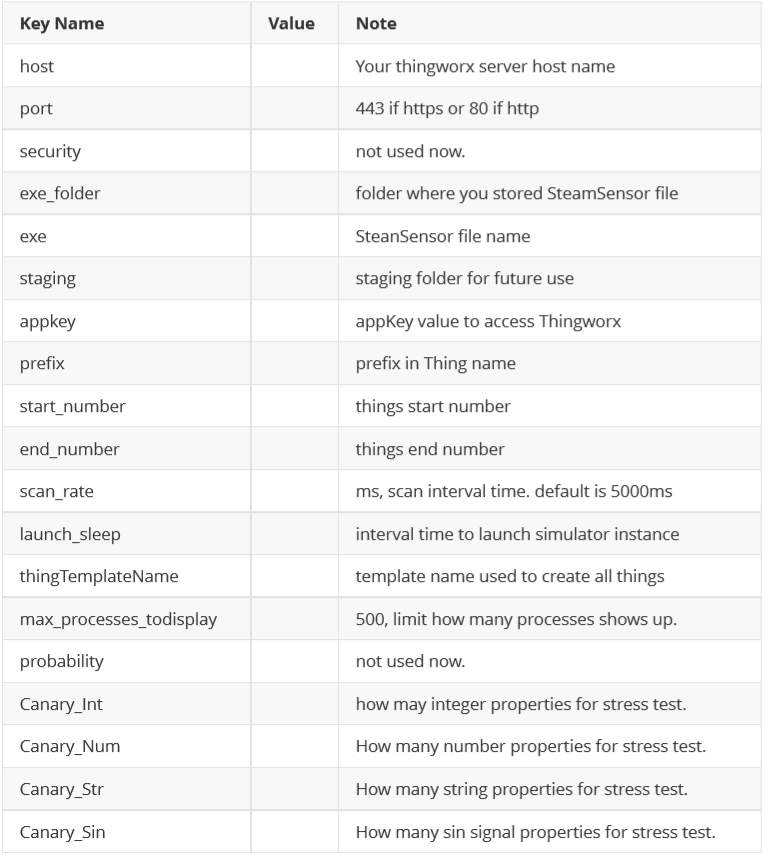
- Edit this file to meet your environment needs, based on the information below
- Open /opt/csim/simulator.json (or whatever path is used instead)
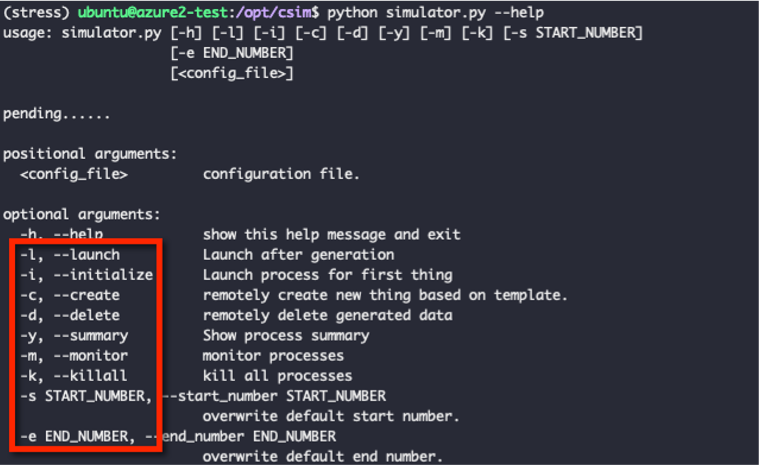
- Familiarize yourself with the simulator.py file and its options
Use the following command to get option information:python simulator.py --help
Set-Up Test Scenario:
- Plan your test
Each simulator instance will have 8 remote properties by default (as shown in the picture in the Background section). More properties can be added for stress test purposes in the simulator.json file.
For the simulator to run 1k writes per second to a time series database, use the following configuration information (note that for this test, a machine with 4 cores and 16G of memory was used. Greater hardware specifications may be required for a larger test):- Forget about the default 8 properties, which have random update patterns and result in difficult results to check later. Instead, create "canary properties" for each thing (where canary refers to the nature of a thing to notify others of danger, in the same way canaries were used in mine shafts)
- Add 25 properties for each thing:
- 10 integer properties
- 5 number properties
- 5 string properties
- 5 sin properties (signals)
- Set the scan rate to 5000 ms, making it so that each of these 25 properties will update every 5 seconds. To get a writes per second rate of 1k, we therefore need 200 devices in total, which is specified by the start and end number lines of the configuration file
- The simulator.json file should look like this:
Canary_Int: 10 Canary_Num: 5 Canary_Str: 5 Canary_Sin: 5 Start_Number: 1 End_Number: 200
- Run the simulator
- Enter the /opt/csim folder, and execute the following command:
python simulator.py ./simulator.json -i - You should be able to see a screen like this:
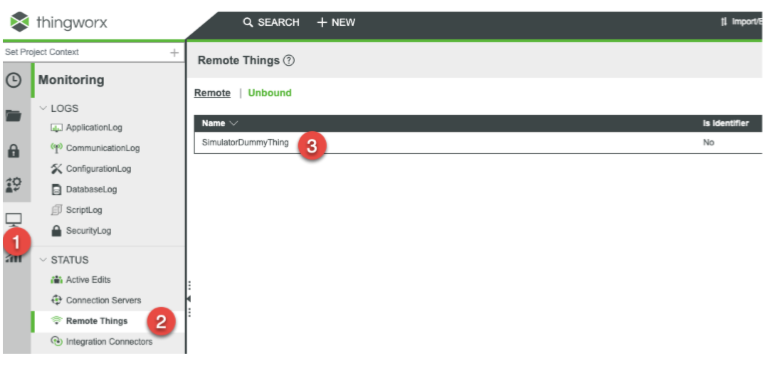
- Go to ThingWorx to check if there is a dummy thing (under Remote Things in the Monitoring section):
This indicates that the simulator is running correctly and connected to ThingWorx
- Enter the /opt/csim folder, and execute the following command:
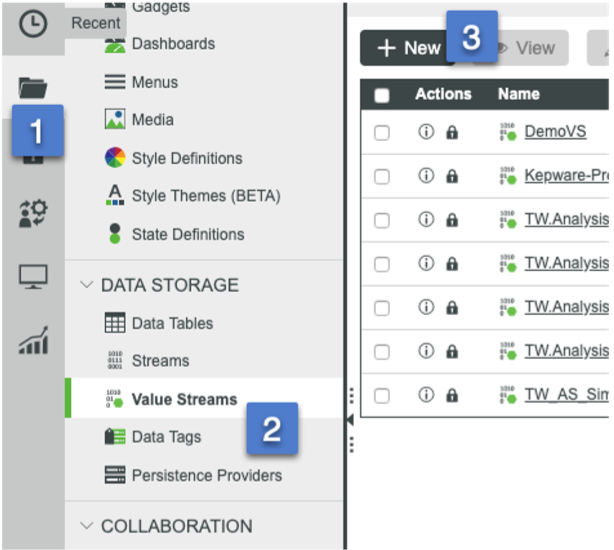
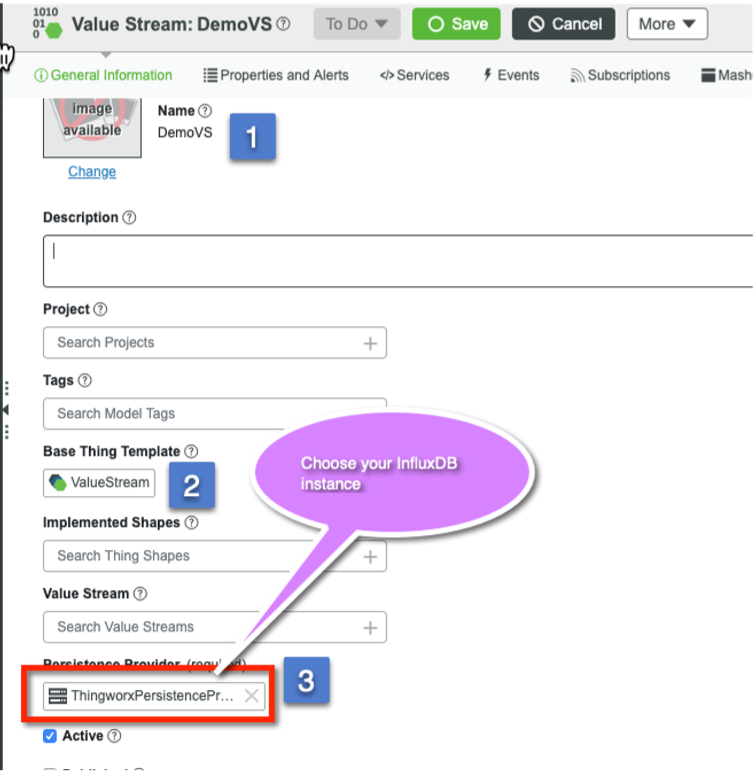
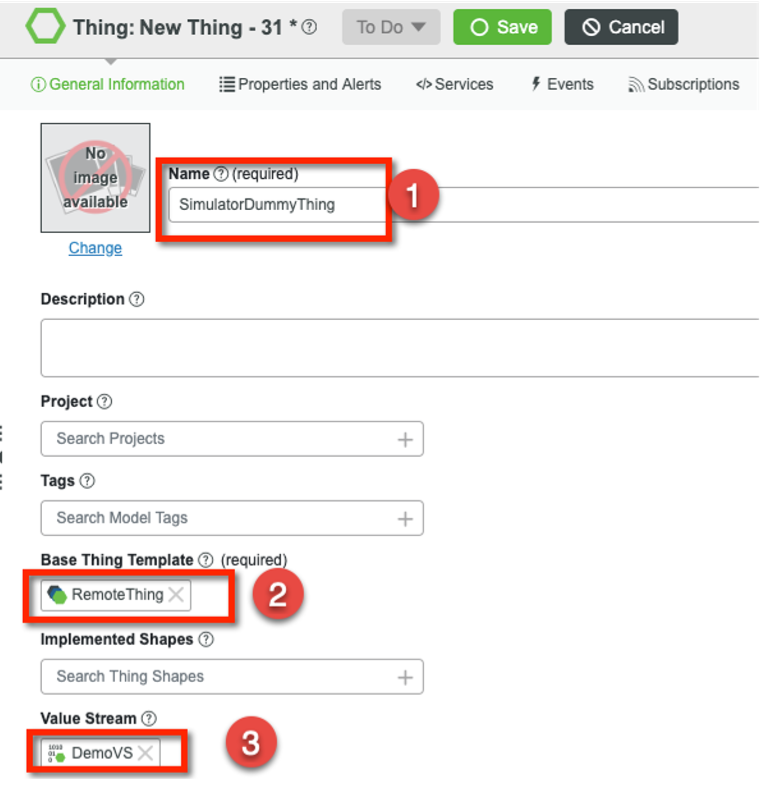
- Create a Value Stream and point it at the target database
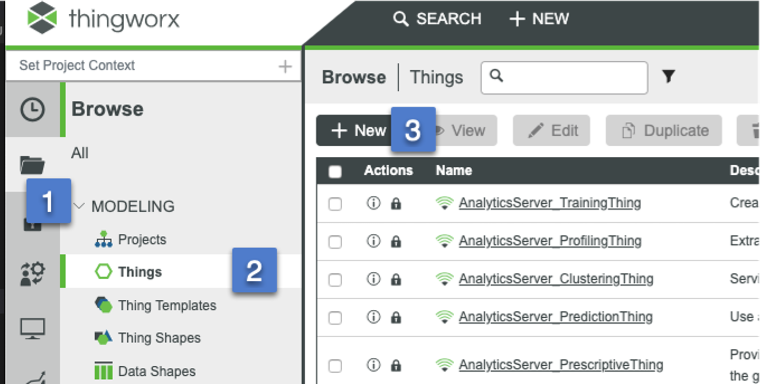
- Create a new thing and call it "SimulatorDummyThing"
Once this is created successfully and saved, a message should pop up to say that the device was successfully connected - Bind the remote properties to the new thing
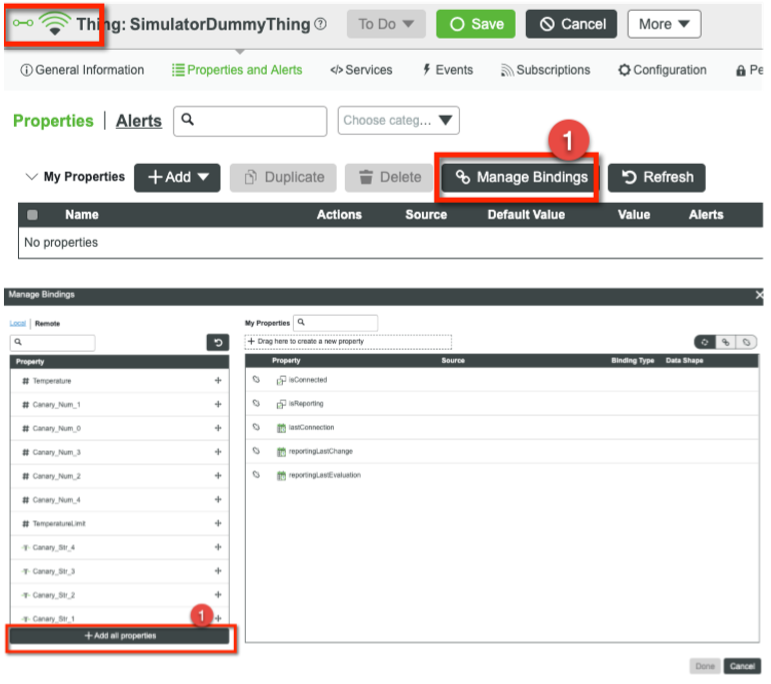
- Click the "Properties and Alerts" tab
- Click "Manage Bindings"
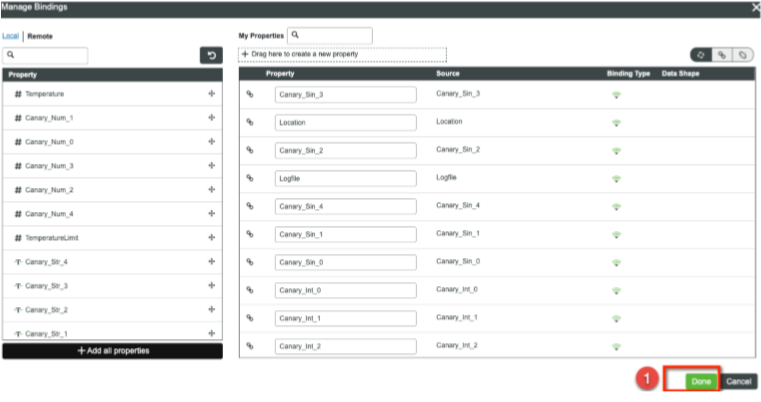
- Click "Add all properties"
- Click "Done" and then "Save"
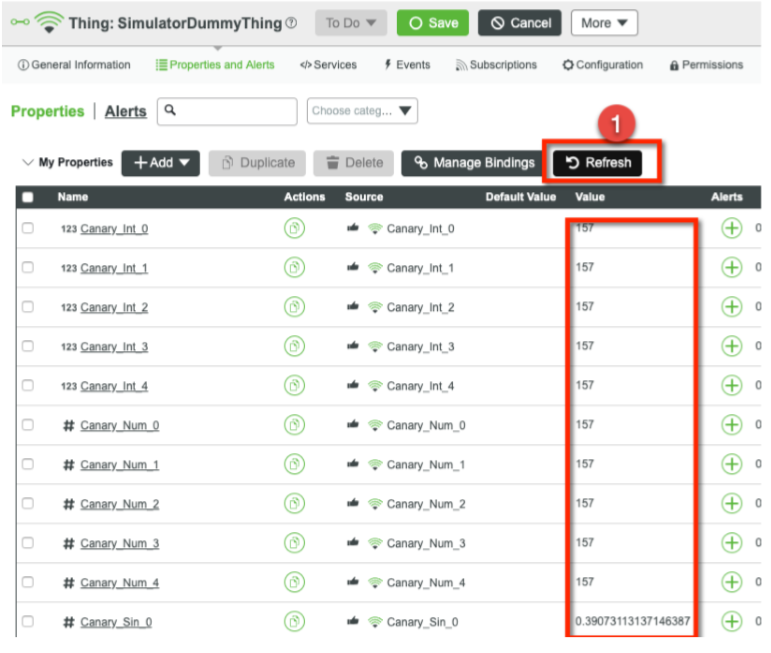
- The properties should begin updating immediately (every 5 seconds), so click "Refresh" to check
- Click the "Properties and Alerts" tab
- Create a Thing Template from this thing
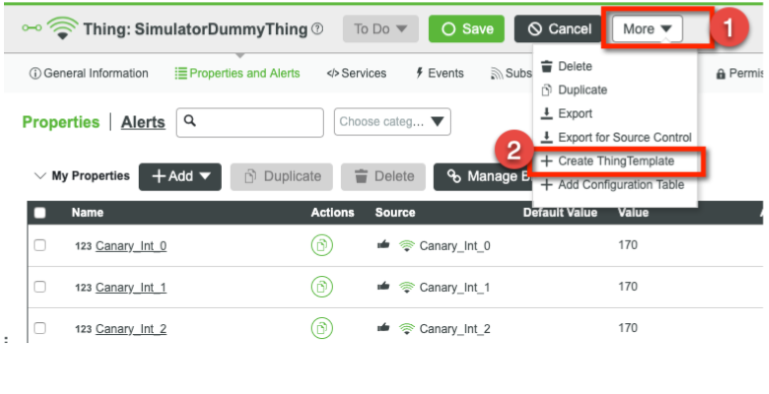
- Click the "More" drop-down and select "Create ThingTemplate"
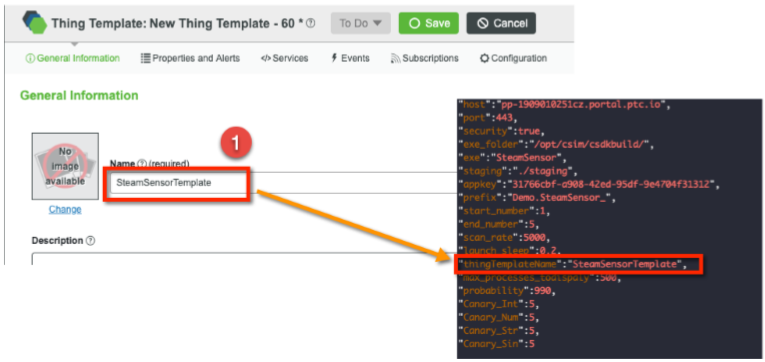
- Give the template a name (ensure it matches what is defined in the simulator.json file) and save it
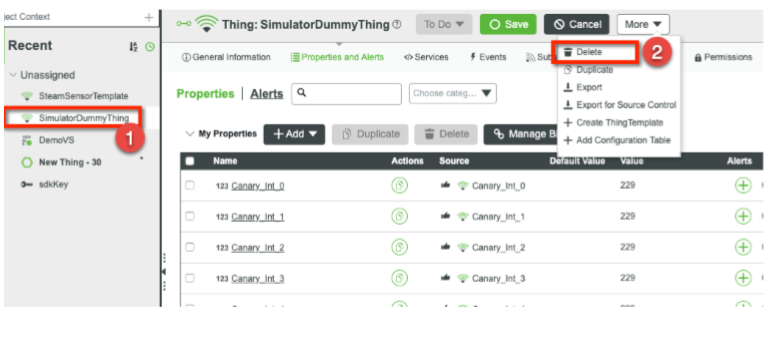
- Go back and delete the dummy thing created in Step 4, as now we no longer need it
- Click the "More" drop-down and select "Create ThingTemplate"
- Clean up the simulator
- Use the following command:
python simulator.py ./simulator.json -k - Output will look like this:
- Use the following command:
- Create 200 things in ThingWorx for the stress test
- Verify the information in the simulator.json file (especially the start and end numbers) is correct
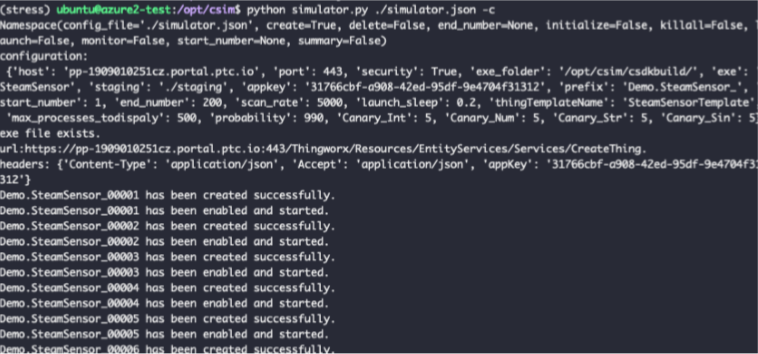
- Use the following command to create all things:
python simulator.py ./simulator.json -c - The output will look like this:
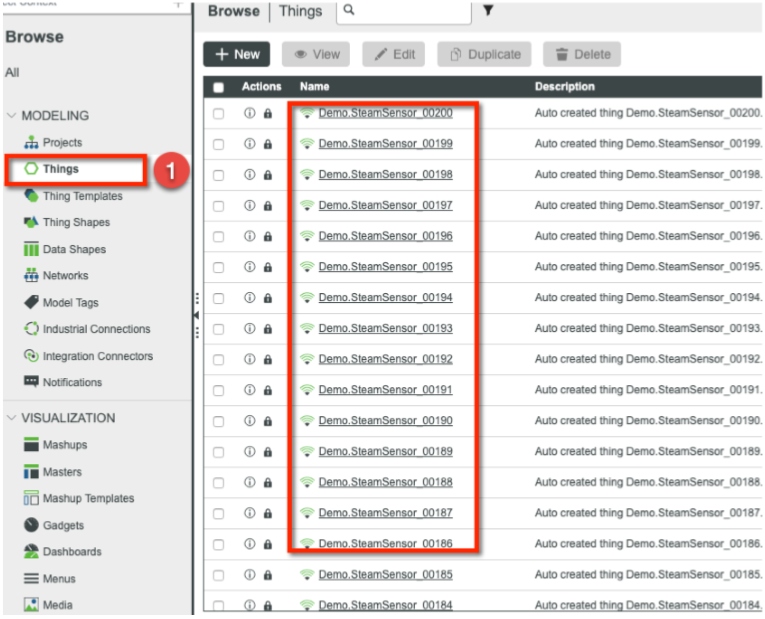
- Verify the things have also been created in ThingWorx:
- Now you are ready for the stress test
- Verify the information in the simulator.json file (especially the start and end numbers) is correct
Run Stress Test:
- Use the following command to start your test:
python simulator.py ./simulator.json -lor
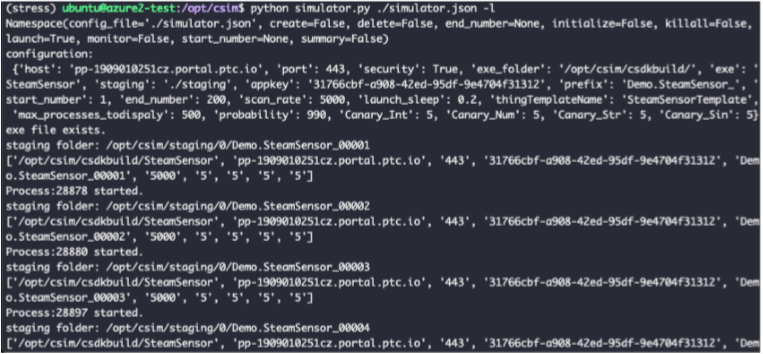
python simulator.py ./simulator.json --launch - The output in the simulator will look like this:
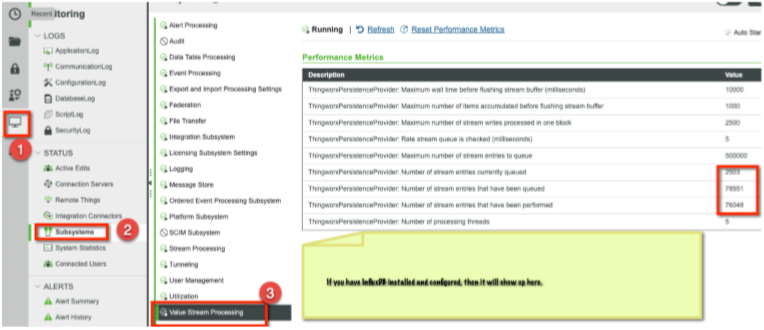
- Monitor the Value Stream writing status in the Monitoring section of ThingWorx:
Stop and Clean Up:
- Use the following command to stop running all instances:
python simulator.py ./simulator -k - If you want to clean up all created dummy things, then use this command:
python simulator.py ./simulator -d - To re-initiate the test at a later date, just repeat the steps in the "Run Stress Test" section above, or re-configure the test by reviewing the steps in the "Set-Up Test Scenario" section
That concludes the tutorial on how to use the C SDK in a stress or load test of a ThingWorx application. Be sure to modify the created Thing Template (created in step 6 of the "Set-Up Test Scenario" section) with any business logic required, for instance events and alerts, to ensure a proper test of the application.
- Mark as Read
- Mark as New
- Bookmark
- Permalink
- Notify Moderator
Great post! Can anyone help me locate the SteamSensor app C source code file used for this load testing activity?
- Mark as Read
- Mark as New
- Bookmark
- Permalink
- Notify Moderator
You guys make the cool stuff. I have also seen the PDF with the maximum ingestion rate and there was a high correlation to the "decompile" of the infotabel into different values. Therefore CPU was the bottleneck. Is there also information available what happens and if it is possible to stream up to 150k/sec from 10-15 Kepware servers into InfluxDB servers. My assumption is, that is might be possible with a machine ~2x more CPU like the one used in the benchmark
- Mark as Read
- Mark as New
- Bookmark
- Permalink
- Notify Moderator
Thanks for the feedback, Stefan!
One of the next simulations we are designing will be similar to the scenario you are describing - multiple factories connected via KepServer(s) to a cloud-deployed ThingWorx instance. I'd be happy to connect with you to talk more about the approach we are taking there.
The real balancing act in these high-speed data ingestion scenarios is two things:
- How quickly you need to ingest data
- How much business logic needs to be run against data as it is ingested
User requests will put load on the platform as well, but if you can minimize the "inline data processing" that needs to run against each data point, your data ingestion rates can be much higher.
The Remote Monitoring of Assets Reference Benckmark we conducted included a decent number of expression rules being processed against each data point as they came in. If you reduced that logic - or switched to a more analytics model where you look for trends and patterns as opposed to individual data points - you would likely be able to support higher data rates on the same infrastructure.
- Mark as Read
- Mark as New
- Bookmark
- Permalink
- Notify Moderator
Observation:
While running the websocket traffic using the Python & C simulator (csim), the server reached its CPU limit when approximately 450 connections were established. The system load averages were vey high. On investigating it further, I saw that the processor run length queue and the system context switches per second were very high.
[root@BLTXLL-IDMA0228 ~]# vmstat -w -S M 10 100
procs -----------------------memory---------------------- ---swap-- -----io---- -system-- --------cpu--------
r b swpd free buff cache si so bi bo in cs us sy id wa st
805 0 0 5039 3 1477 0 0 0 2 3 4 9 11 80 0 0
429 0 0 5038 3 1477 0 0 0 0 70491 629581 42 58 0 0 0
430 0 0 5039 3 1477 0 0 0 0 70458 628943 42 58 0 0 0
427 0 0 5039 3 1477 0 0 0 0 70445 627990 42 58 0 0 0
403 0 0 5039 3 1477 0 0 0 1 70593 630295 43 57 0 0 0
422 0 0 5039 3 1477 0 0 0 1 70501 629272 43 57 0 0 0
429 0 0 5039 3 1477 0 0 0 0 70469 629137 42 58 0 0 0
446 0 0 5041 3 1477 0 0 0 0 70490 628577 42 58 0 0 0
500 0 0 5042 3 1477 0 0 0 0 70544 628094 43 57 0 0 0
453 0 0 5042 3 1477 0 0 0 0 70548 626440 44 56 0 0 0
451 0 0 5040 3 1477 0 0 0 0 70443 629529 43 57 0 0 0
433 0 0 5040 3 1477 0 0 0 0 70535 628144 41 59 0 0 0
443 0 0 5040 3 1477 0 0 0 0 70534 627692 41 59 0 0 0
^C

[root@BLTXLL-IDMA0228 ~]# cat /proc/loadavg
431.23 425.81 422.87 557/5116 105907
It seems like by spawning a large number of processes, the system is unable to cope up with these many running and runnable processes and most of the CPU time is being utilised in context switching.
Server details:
CPU - 4 core
RAM - 8 GB
OS - RHEL 7.7
- Mark as Read
- Mark as New
- Bookmark
- Permalink
- Notify Moderator
Hi, Ravi2:
Thank you for your comment. I'm the original person who developed this test approach (Draft) and appreciate comment/recommendation for further enhancement.
Your observation is correct and it's anticipated. Few quick comments:
#1) Always run simulator in dedicated VM, please don't run it with TWX server together.
#2) C-SDK may use 3-5 threads at OS level for one instance. Running 450 things on a 4 core/8G memory box will exhaust CPU for sure.
#3) Interval time also impacts CPU/Memory consumption.
If I remember correctly, 200 instances with 5 seconds internal time could be barely supported stably on 4 Core/16G memory Ubuntu 16.04 box 2 years ago.
Kindly please let me know this answers your question or not.
- Mark as Read
- Mark as New
- Bookmark
- Permalink
- Notify Moderator
Hi DeShengXu,
Thank you for the response.
Yes, your post does answer my questions. As per my findings, it is the CPU, not the memory, which is the limiting factor for running the simulation traffic. Increasing the number of CPU cores comes at a premium, and becomes difficult to justify for test machines.
Since I wanted to achieve a higher simulation traffic throughput, I modified (well actually ported it to Java) the design of the simulator from multi-process to multi-threaded utilising the same settings.json configuration. With the change, I was able to achieve 10k connected things in the Thingworx server.
Currently I have only ported the websocket traffic module. If it is of interest to you, I can share the code for your review.
Regards,
Ravi
- Mark as Read
- Mark as New
- Bookmark
- Permalink
- Notify Moderator
You can directly use Java SDK to build simulator and it can perform way more better than C-SDK. If you mainly want to simulate websocket traffic, Java SDK should be the best choice, or the only choice, but not C-SDK.
There are several Java-SDK based simulator already in the field I believe.
- Mark as Read
- Mark as New
- Bookmark
- Permalink
- Notify Moderator
I understand. But what could be the reason for Java SDK performing better than C SDK? Is it something related to C-SDK being targeted for constrained IoT devices?
- Mark as Read
- Mark as New
- Bookmark
- Permalink
- Notify Moderator
correct, it may not be the only reason but definitely an important reason.
- Mark as Read
- Mark as New
- Bookmark
- Permalink
- Notify Moderator
Hi Mike,
it might be a temporary fix to enable the connection servers to ingest data that just need to be stored into the influxdb. This might be done through a direct write to the influxdb, which I think is not possible because of different architecture limits. Or we can organize it at the connection server into a better way and stream it to the main server efficiently to store it faster than today. if someday in future the active-active also can work as a load balancer this should be fine too. But I have strong concerns regarding the timeline.
- Mark as Read
- Mark as New
- Bookmark
- Permalink
- Notify Moderator
Great post indeed! I was also wondering where to find the SteamSensor source code so that I can make a more realistic test of my use case.
please help me here.
Also, another question from my side to the team is; what is your suggestion for the easiest way I could perform file transfers on these multiple agents?
I wanted to load test how the system behaves with concurrent file transfers from multiple agents.
Thanks in advance!
- Mark as Read
- Mark as New
- Bookmark
- Permalink
- Notify Moderator
1. The SteamSensor source code is part of the CSDK. You can find it in the examples/SteamSensor folder.
2. You need to add a few lines of code to add the additional properties. But the original code is enough for a simple simulation test.
3. If you want to test `FileTransfer` for multiple agents, you need to assign a different staging folder for each agent.


