Monitor an SMT Assembly Line Part 2
- November 9, 2022
- 0 replies
- 566 views
Step 4: Implement New Features
The SMT Assembly Line Data Model was built around a sample manufacturing facility that tracks critical data points, including diagnostic information for:
- motherboards
- assembly machines
- assembly line performance
To make informed decisions based on the diagnostic and performance data, you can add features that will increase analytics capabilities.
In this optional step, we'll add a Line Chart to see the performance of any given assembly machine. Once completed, we can create Services that will be used to make calculations on the data we have generated from the assembly line.
For a final challenge, you can create a service that will compare data points to identify what works best in an assembly machine, a larger internal queue, or more placement heads.
Setup New Mashup
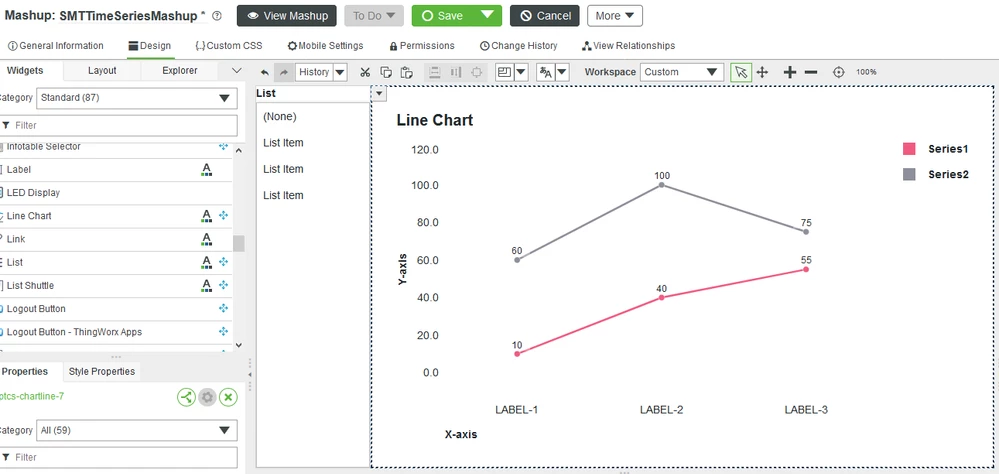
- Create a Mashup that is Responsive and name it SMTTimeSeriesMashup.
- Click the Layout tab and add a column to the canvas.
- Drag and drop a List Widget onto the left column of the layout.
- Drag-and-drop a Line Chart Widget onto the other column of the layout.

Configure List Widget
- Add the GetImplementingThingsWithData Service of the AssemblyMachineTemplate Thing Template as a data source in the Mashup. Ensure the checkbox for Execute on Load is checked.
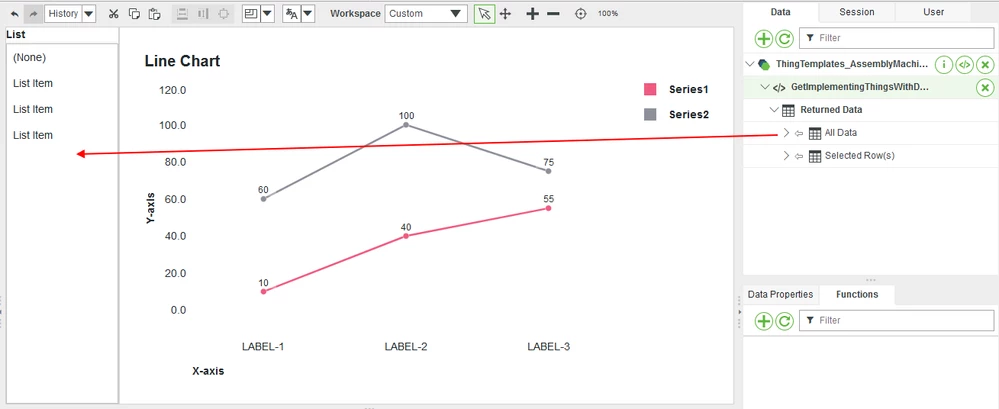
- Drag-and-drop GetImplementingThingsWithData > Returned Data > All Data to the List Widget.
On the Select Binding Target pop-up, select Data.

- With the List widget selected, for the DisplayField property dropdown, select name.
- In the ValueField property dropdown, select name.
Configure Time Series Data
- Add the Dynamic QueryPropertyHistory Service of the AssemblyMachineTemplate Thing Template as a data source in the Mashup. Ensure the checkbox for Execute on Load is checked.
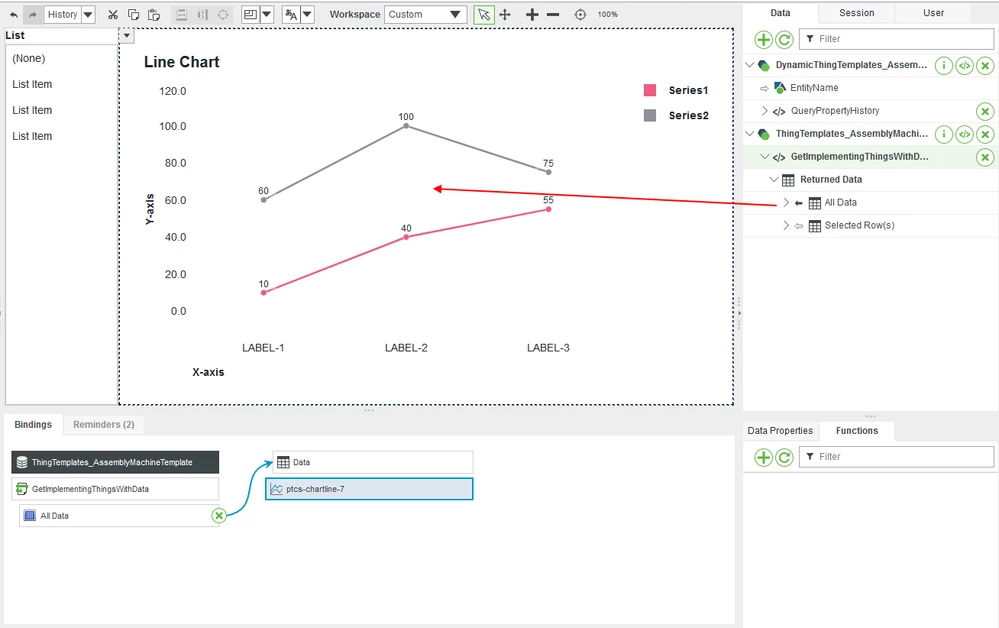
- Drag-and-drop QueryPropertyHistory > Returned Data > All Data to the Time Series Chart Widget.
- On the Select Binding Target pop-up, select Data.
- For the XAxisField property dropdown, select timestamp.
- For the DataField1 property dropdown, select IdleTime OR MotherboardsCompleted.

Connect Widgets
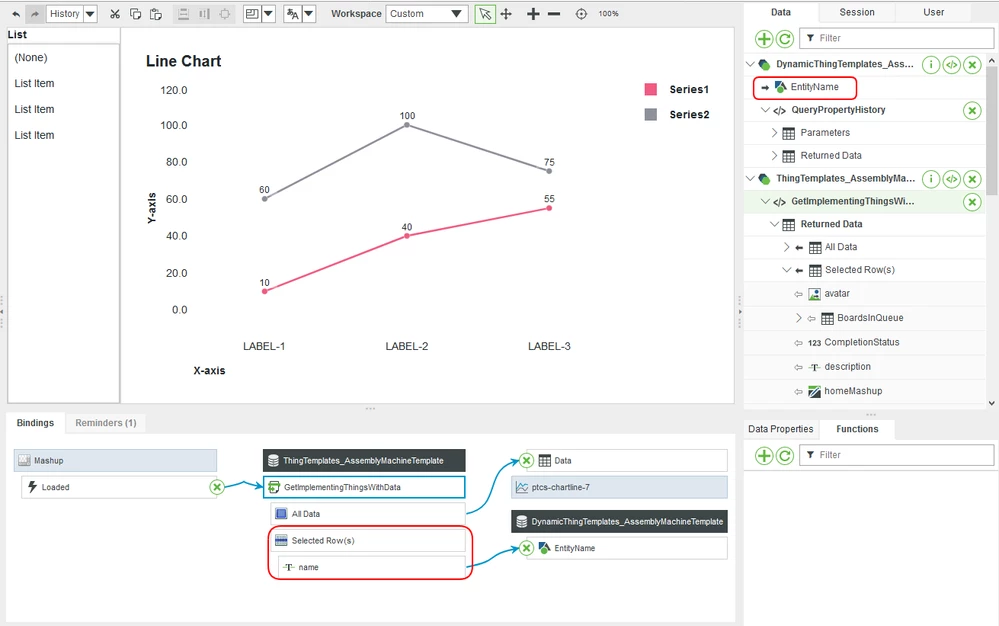
- Drag-and-drop the GetImplementingThingsWithData > Returned Data > Selected Row(s) > name property to the EntityName parameter for the Dynamic AssemblyMachineTemplate data source.
Select the GetImplementingThingsWithData service, then drag-and-drop the SelectedRowChanged event onto QueryPropertyHistory.

- Click Save.
- After the save is complete, click View Mashup.
You are now able to see what the idle time is for each assemble machine over the span of its use.
Create Service
You can add JavaScript code to calculate the average completion time for the motherboard assembly.
- Open the MotherboardTemplate ThingTemplate in Composer.
- Create a new Service titled CompletionTime.
- For the Output type, select Number.
- Enter the following code into the JavaScript window and save:
var diff = 1;

if(me.EndTime != null && me.StartTime != null){
 diff = Math.abs(me.EndTime - me.StartTime);
}

//Seconds
var result = Math.round(diff/1000);

//Minutes
//var result = Math.round((diff/1000)/60);
You can now calculate the time it takes for an individual motherboard to be completed. Create a service to be used with the GetCompletedMotherboards service (returns a list of all completed Raspberry Pi motherboards) with the SMTAssemblyLineTemplate ThingTemplate to calculate the average time for your assembly line to complete a motherboard. Finish this Service and add configure it to work with your new Mashup.
Step 5: Next Steps
Congratulations! You've successfully completed the ThingWorx Monitor an SMT Assembly Line Guide, learning how to use ThingWorx to create an application that provides real-time insight into connected assets.
Learn More
We recommend the following resources to continue your learning experience:
Capability Guide
| Build | Design Your Data Model |
| Build | Implement Services, Events, and Subscriptions |
| Connect | Java SDK Tutorial |
Additional Resources
If you have questions, issues, or need additional information, refer to:
Resource Link
| Community | Developer Community Forum |
| Support | Java Edge SDK Help Center |

