Top 5 Monitoring Best Practices
By Tim Atwood and Dave Bernbeck, Edited by Tori Firewind
Adapted from the March 2021 Expert Session
Produced by the IoT Enterprise Deployment Center
The primary purpose of monitoring is to determine when your application may be exhausting the available resources. Knowledge of the infrastructure limits help establish these monitoring boundaries, determining straightforward thresholds that indicate an app has gone too far. The four main areas to monitor in this way are CPU, Memory, Networking, and Disk.
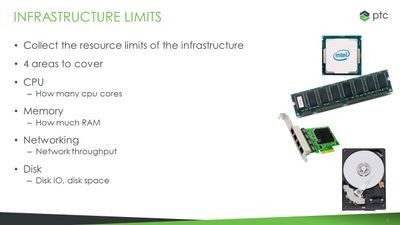
For the CPU, we want to know how many cores are available to the application and potentially what the temperature is for each or other indicators of overtaxation. For Memory, we want to know how much RAM is available for the application. For Networking, we want to know the network throughput, the available bandwidth, and how capable the network cards are in general. For Disk, we keep track of the read and write rates of the disks used by the application as well as how much space remains on those.
There are several major infrastructure categories which reflect common modes of operation for ThingWorx applications. One is Bare Metal, which relies upon the traditional use of hardware to connect directly between operating system and hardware, with no intermediary. Limits of the hardware in this case can be found in manufacturing specifications, within the operating system settings, and listed somewhere within the IT department normally. The IT team is a great resource for obtaining these limits in general, also keeping track of such things in VMware and virtualized infrastructure models.
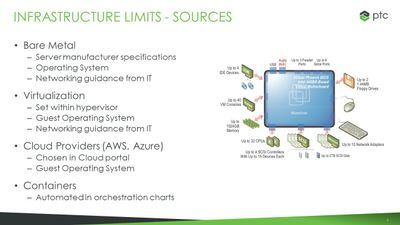 VMware is an intermediary between the operating system and the hardware, and often its limits are determined based on the sizing of the application and set by the IT team when the infrastructure is established. These can often be resized as needed, and the IT team will be well aware of the limits here, often monitoring some of the performance themselves already. This is especially so if Cloud Providers are used, given that these are scaled up virtualizations which are configured in easy-to-use cloud portals. These two infrastructure models can also be resized as needed.
Lastly Containers can be used to designate operating system resources as needed, in a much more specific way that better supports the sharing of resources across multiple systems. Here the limits are defined in configuration files or charts that define the container.
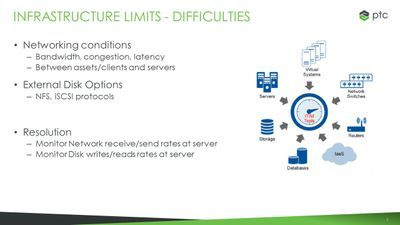
The difficulties here center around learning what the limits are, especially in the case of network and disk usage. Network bandwidth can fluctuate, and increased latency and network congestion can occur at random times for seemingly no reason. Most monitoring scenarios can therefore make due with collecting network send and receive rates, as well as disk read and write rates, performed on the server.
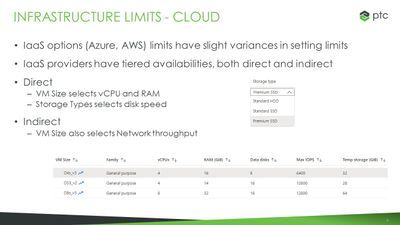
Cloud Providers like Azure provide VM and disk sizing options that allow you to select exactly what you need, but for network throughput or network IO, the choices are not as varied. Network IO tends to increase with the size of the VM, proportional to the number of CPU cores and the amount of Memory, so this may mean that a VM has to be oversized for the user load, for the bulk of the application, in order to accommodate a large or noisy edge fleet.
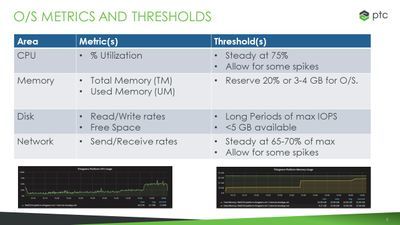
The next few slides list the operating metrics and common thresholds used for each. We often use these thresholds in our own simulations here at PTC, but note that each use case is different, and each situation should be analyzed individually before determining set limits of performance.
Generally, you will want to monitor: % utilization of all CPU cores, leaving plenty of room for spikes in
activity; total and used memory, ensuring total memory remains constant throughout and used memory remains below a reasonable percentage of the total, which for smaller systems (16 GB and lower) means leaving around 20% Memory for the OS, and for larger systems, usually around 3-4 GB.
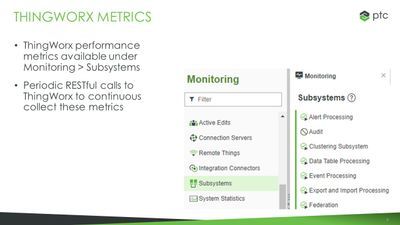
For disks, the read and write rates to ensure there is ample free space for spikes and to avoid any situation that might result in system down time;
and for networking, the send and receive rates which should be below 70% or so, again to leave room for spikes.
In any monitoring situation, high consistent utilization
should trigger concern and an investigation into
what’s happening. Were new assets added? Has any recent change caused regression or other issues?
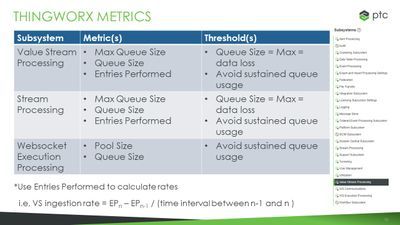
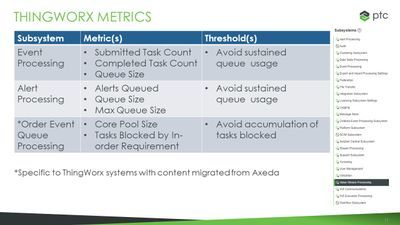
Any resent changes should be inspected and the infrastructure sizing should be considered as well. For ThingWorx specific monitoring, we look at max queue sizes, entries performed, pool sizes, alerts, submitted task counts, and anything that might
indicate some kind of data loss. We want the queues to be consistently cleared out to reduce the risk of losing data in the case of an interruption, and to ensure there is no reason for resource use to build up and cause issues over time.
In order for a monitoring set-up to be truly helpful, it needs
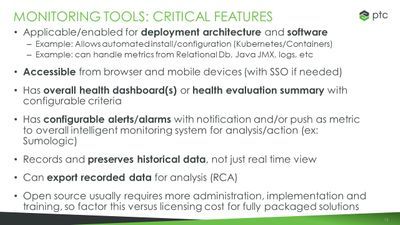
to make certain information easily accessible to administrative users of the application. Any metrics that are applicable to performance needs to be processed and recorded in a location that can be accessed quickly and easily from wherever the admins are. They should quickly and easily know the health of the application from a glance, without needing to drill down a lot to be made aware of issues. Likewise, the alerts that happen should be
meaningful, with minimal false alarms, and it is best if this is configurable by the admins from within the application via some sort of rules engine (see the DGIS guide, soon to be released in version 9.1). The
monitoring tool should also be able to save the system history and export it for further analysis, all in the name of reducing future downtime and creating a stable, enterprise system.
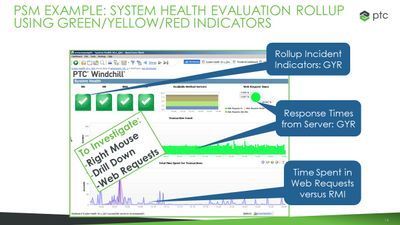
This dashboard (above) is a good example of how to
rollup a number of performance criteria into health indicators for various aspects of the application. Here there is a Green-Yellow-Red color-coding system for issues like web requests taking longer than 30s, 3 minutes, or more to respond.
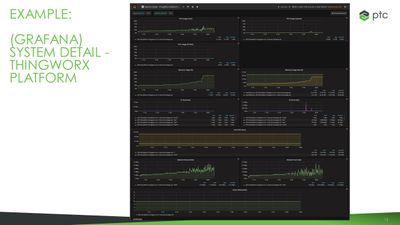
Grafana is another application used for monitoring internally by our team. The easy dashboard creation feature and built-in chart modes make this tool
super easy to get started with, and certainly easy to refer to from a central location over time.
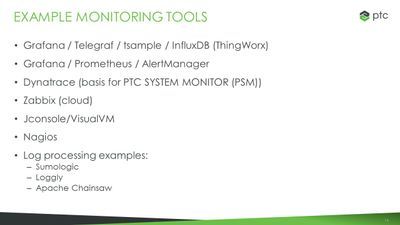
Setting this up is helpful for load testing and making ready an application, but it is also beneficial for continued monitoring post-go-live, and hence why it is a worthy investment. Our team usually builds a link based on the start and end time of tests for each simulation performed, with all of the various servers being monitored by one Grafana server, one reference point.
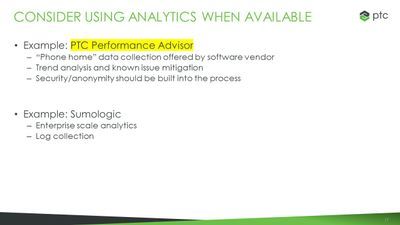
Consider using PTC Performance Advisor to help monitor these kinds of things more easily (also called DynaTrace).
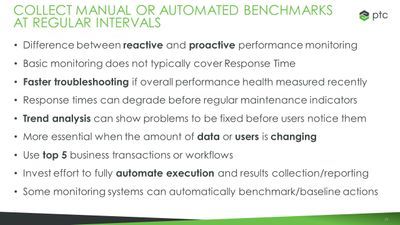
When most administrators think of monitoring, they think of reading and reacting to dashboards, alerts, and reports. Rarely does the idea of benchmarking come to mind as a monitoring activity, and yet, having successful benchmarks of system performance can be a crucial part of knowing if an application is functioning as expected before there are major issues. Benchmarks also look at the response time of the server and can better enable
tracking of actual end user experience. The best
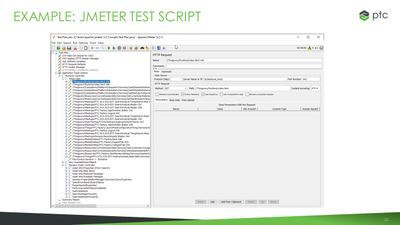
option is to automate such tests using JMeter or other applications, producing a daily snapshot of user performance that can anticipate future issues and create a more reliable experience for end users over time.
Another tool to make use of is JMeter, which has the option to build custom reports. JMeter is good for simulating the user load, which often makes up most of the server load of a ThingWorx application, especially considering that ingestion is typically optimized independently and given the most thought. The most unexpected issues tend to pop up within the application itself, after the project has gone live.
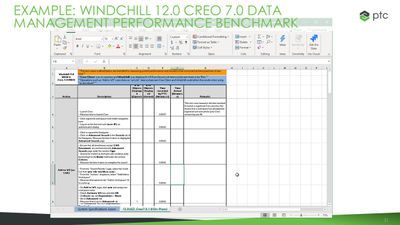
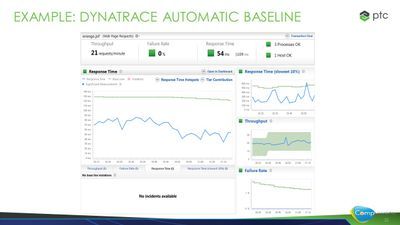
Shown here (right) is an example benchmark from a Windchill application, one which is published by PTC to facilitate comparison between optimized test systems and real life performance. Likewise, DynaTrace is depicted here, showing an automated baseline (using Smart URL Detection) on Response Time (Median and 90th percentile) as well as Failure Rate. We can also look at Throughput and compare it with the expected value range based on historical throughput data.

Monitoring typically increases system performance
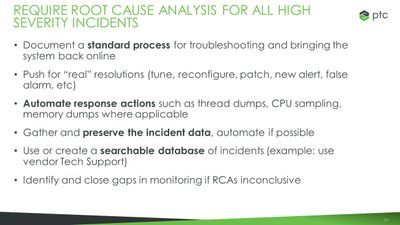
and availability, but its other advantage is to provide faster, more effective troubleshooting. Establish a systematic process or checklist to step through when problems occur, something that is organized to be done quickly, but still takes the time to find and fix the underlying problems. This will prevent issues from happening again and again and polish the system periodically as problems occur, so that the stability and integrity of the system only improves over time. Push for real solutions if possible, not band-aids, even if more downtime is needed up front; it is always better to have planned downtime up front than unplanned downtime down the line. Close any monitoring gaps when issues do occur, which is the valid RCA response if not enough information was captured to actually diagnose or resolve the issue.
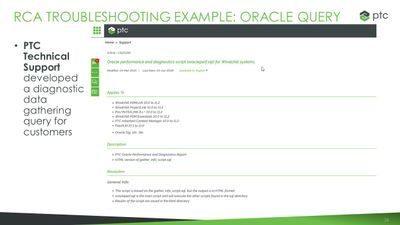 PTC Tech Support developed a diagnostic data gathering query for Oracle that customers can use, found in our knowledgebase. This is an example of RCA troubleshooting that looks at different database factors, reporting on which queries perform the worst
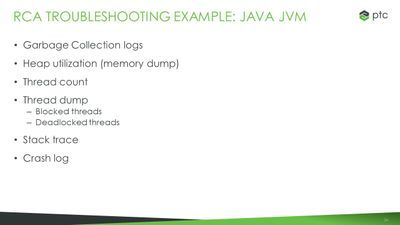
based on inputted criteria. Another example of troubleshooting is for the Java JVM, where we look at all of the things listed here (below) in an automated, documented process that then generates a report for easy end user consumption.
Don’t hesitate to reach out to PTC Technical Support in advance to go over your RCA processes, to review benchmark discrepancies between what PTC publishes and what your real-life systems show, and to ensure your monitoring is adequate to maintain system stability and availability at all times.
