Community Tip - You can subscribe to a forum, label or individual post and receive email notifications when someone posts a new topic or reply. Learn more! X
- Community
- Creo+ and Creo Parametric
- Manufacturing (CAM)
- Did You Know? Connection Analysis
- Subscribe to RSS Feed
- Mark Topic as New
- Mark Topic as Read
- Float this Topic for Current User
- Bookmark
- Subscribe
- Mute
- Printer Friendly Page
Did You Know? Connection Analysis
- Mark as New
- Bookmark
- Subscribe
- Mute
- Subscribe to RSS Feed
- Permalink
- Notify Moderator
Did You Know? Connection Analysis
Technical surfacing and analysis has become a whole lot easier with PTC Creo 3.0. The latest productivity enhancements enable you to quickly and easily investigate the challenging parts of your geometry. In today’s blog post we will discuss how to analyze the curves and surfaces in your model for position, tangency, and curvature continuity using the Connection Analysis feature. The Connection Analysis features shows where geometric connections are not met based on the desired input and tolerance. In this post, Paul Sagar, Vice President of Product Management, explains more here:
To begin, click on the Analysis tab, open the Inspect Geometry drop down menu, and select Connection to open the Connection Analysis dialogue box.
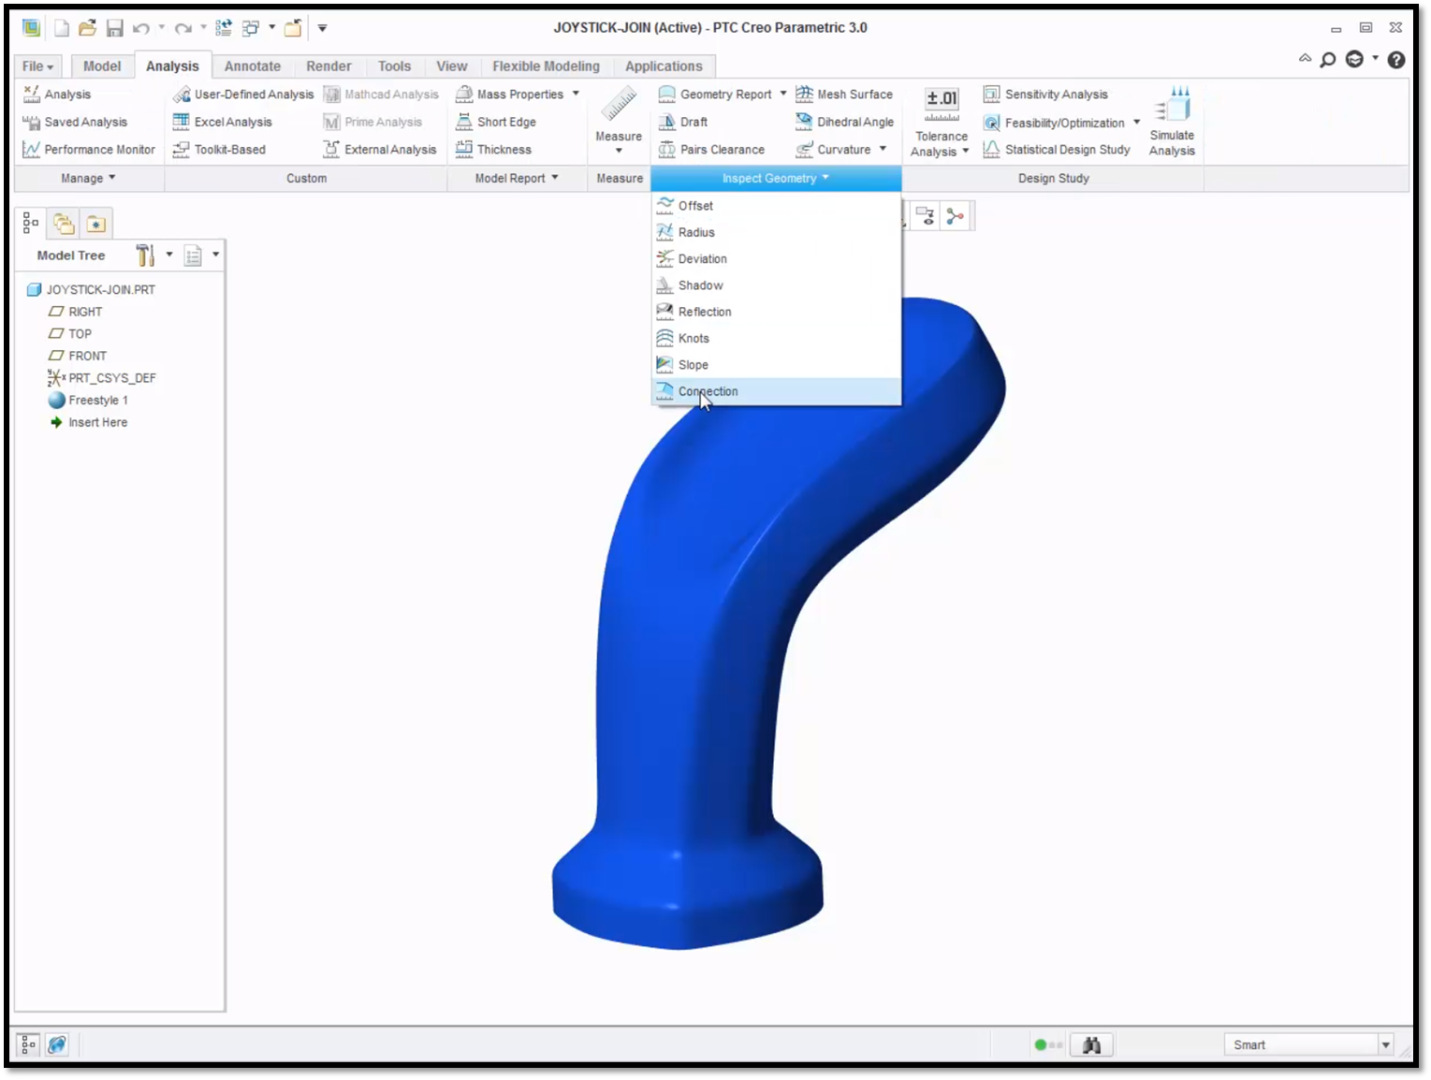
Use the Inspect Geometry drop down menu to select Connection.
The Connection Analysis dialogue box allows you to analyze the Position, Tangency, or Curvature connection between surfaces or curves. For example, if you select Tangency, you can perform a tangency analysis of the entire quilt. To do so, click on the model to select your References. Select Tangency as the Connection to be analyzed and enter the desired Tolerance in degrees. The edges of your model that do not meet the required tangency tolerance are displayed in red and the edges that conform to the tolerance are highlighted in green. If you prefer, you can display the results as spikes by changing the Style to Show spikes.
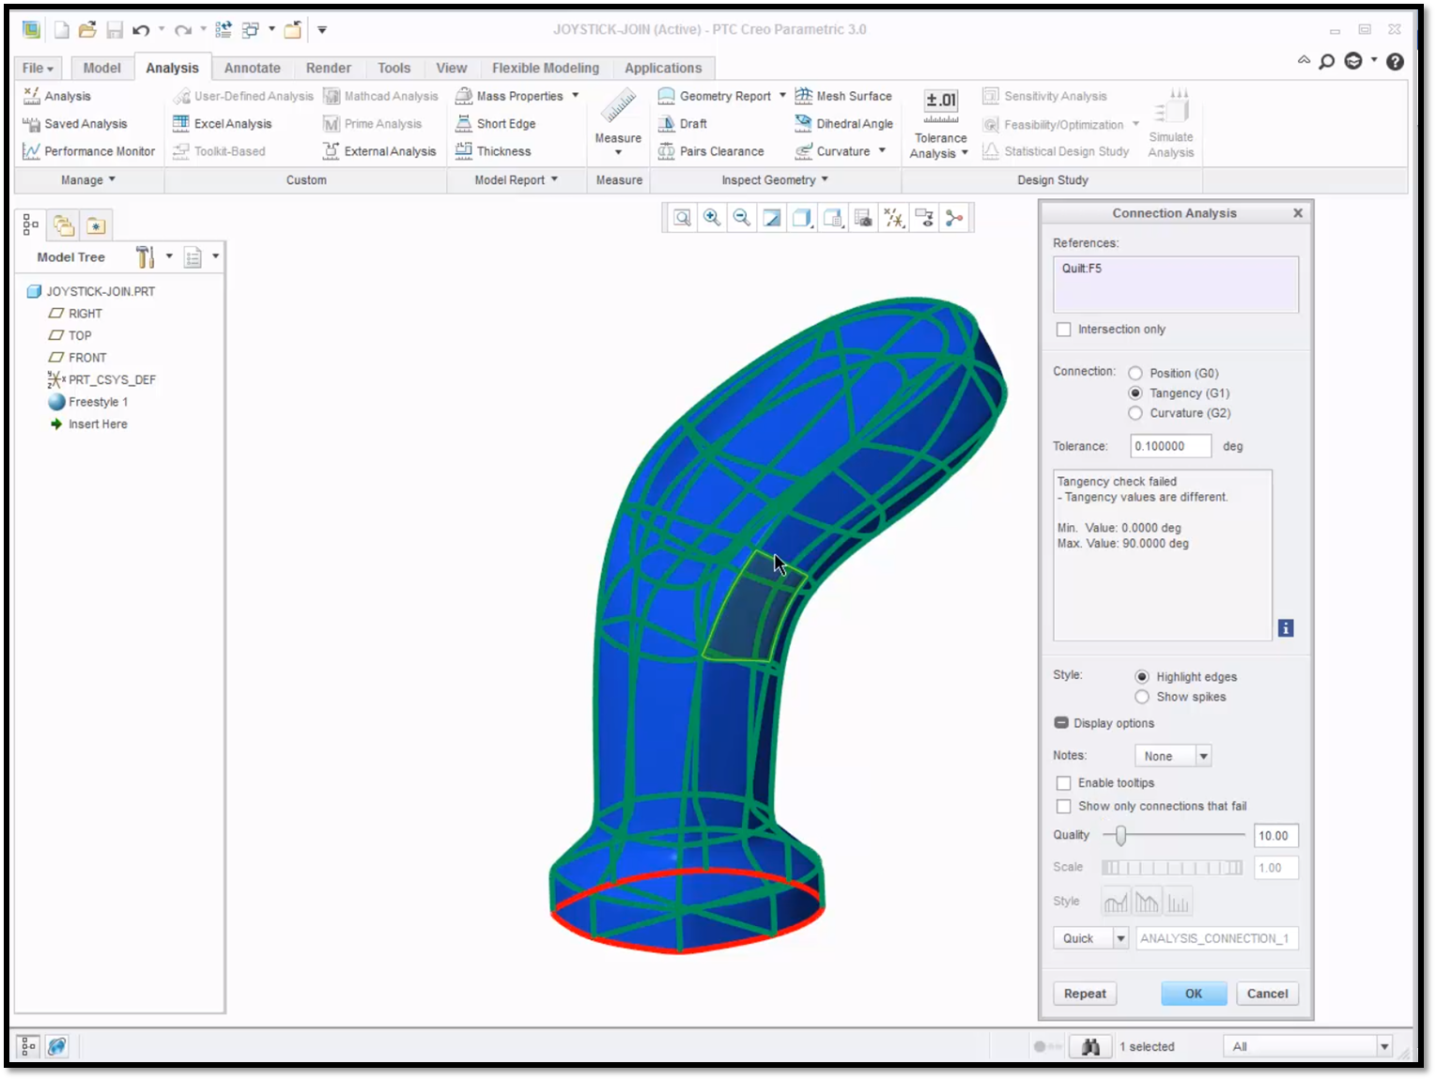
Notice how the areas that pass are shown in green and the areas that fail are shown in red.
To see only areas that fail against tangency and the respective notes, click the plus sign next to Display options. Check the box for Show only connections that fail. Only areas that fail will appear in red.
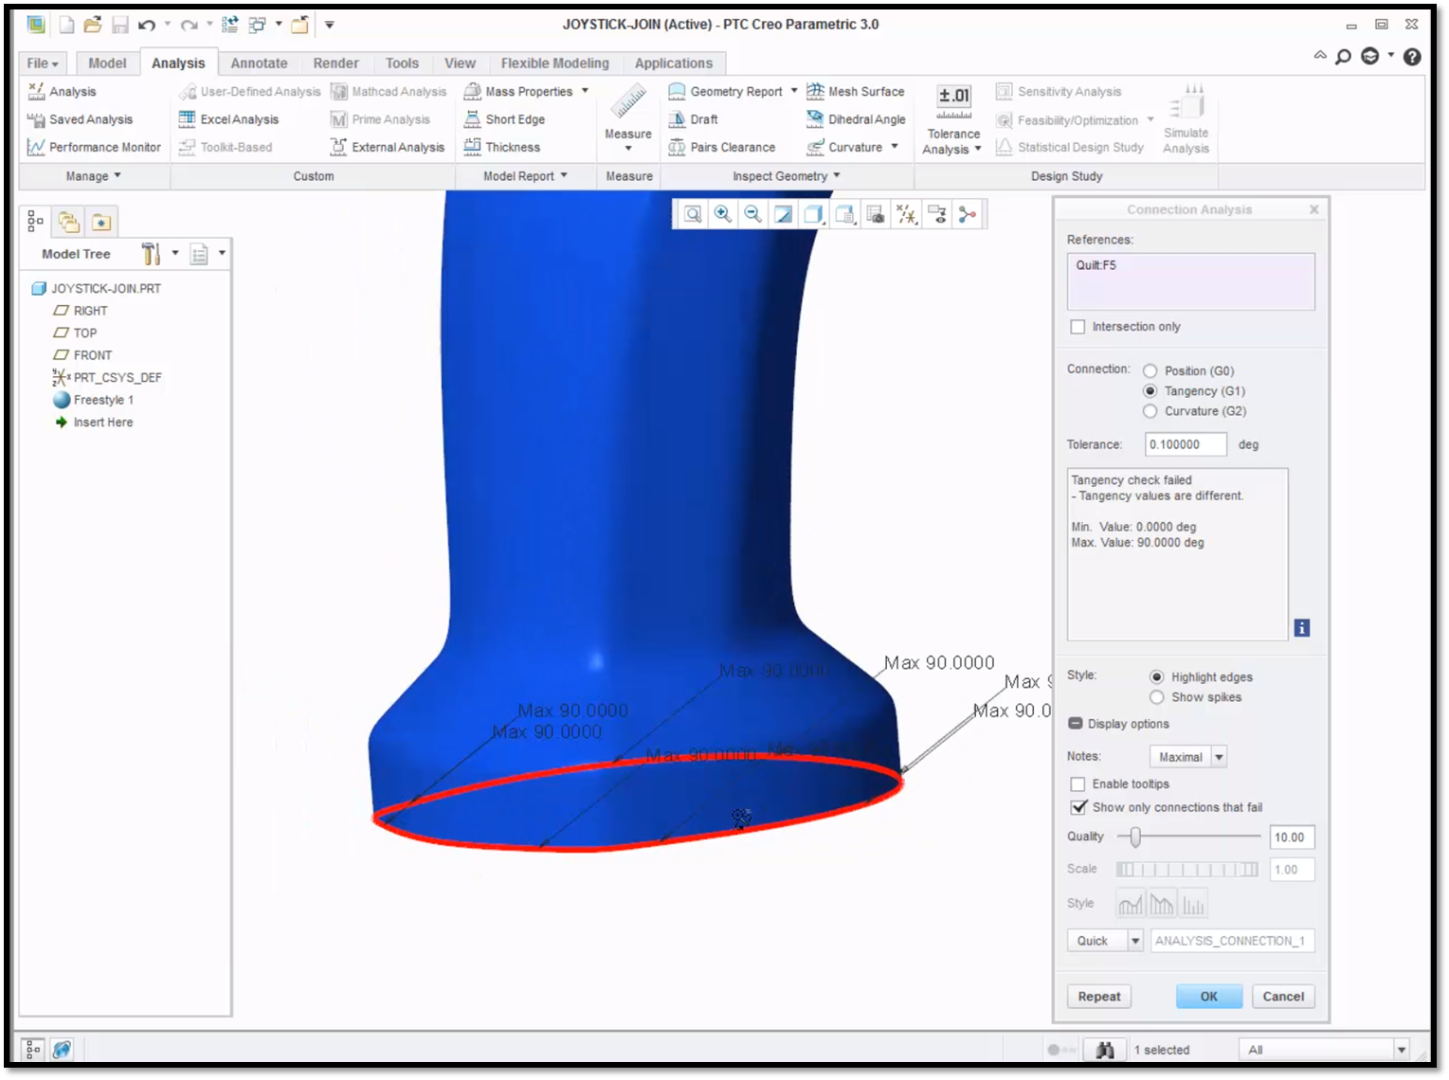 Notice that the areas of failure are highlighted in red.
To see only the areas that fail against Position or Curvature, switch your Connection selection, and enter the desired tolerance. You will see different areas of the model turn red as you toggle between the Connection options.
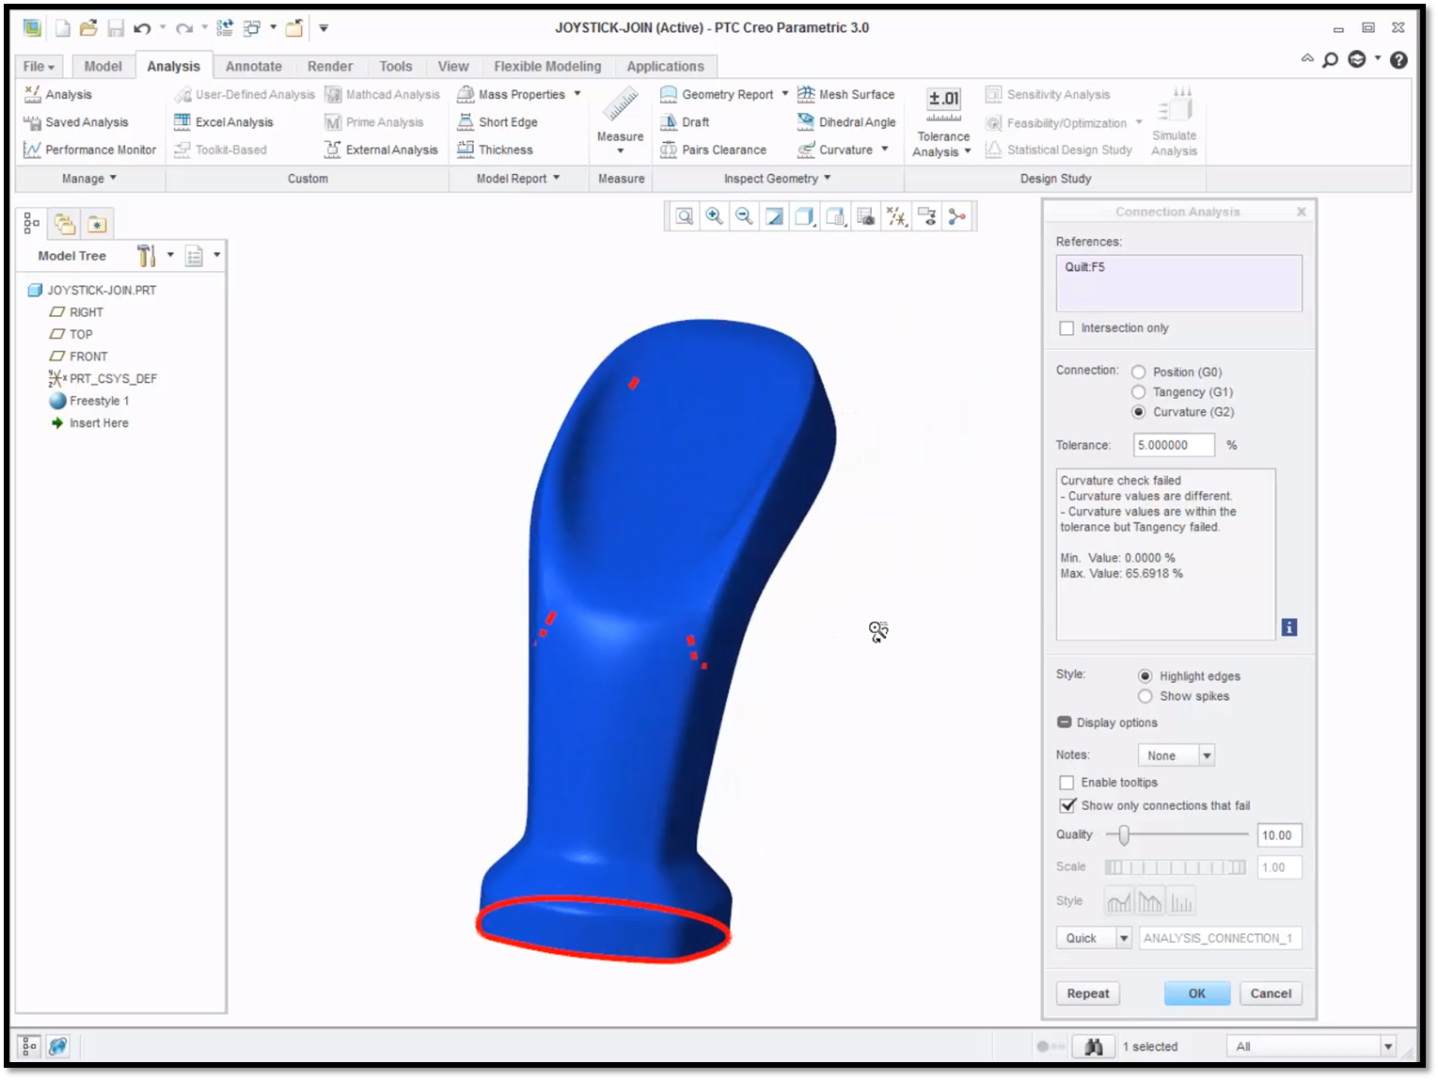
Here you can see the areas where the Curvature connections fail against a Tolerance of 5.0%.
To understand the value of the analysis at a particular location, check the box for Enable tooltips and place your pointer on the area where breaks exist. The value of the analysis will appear at that point.
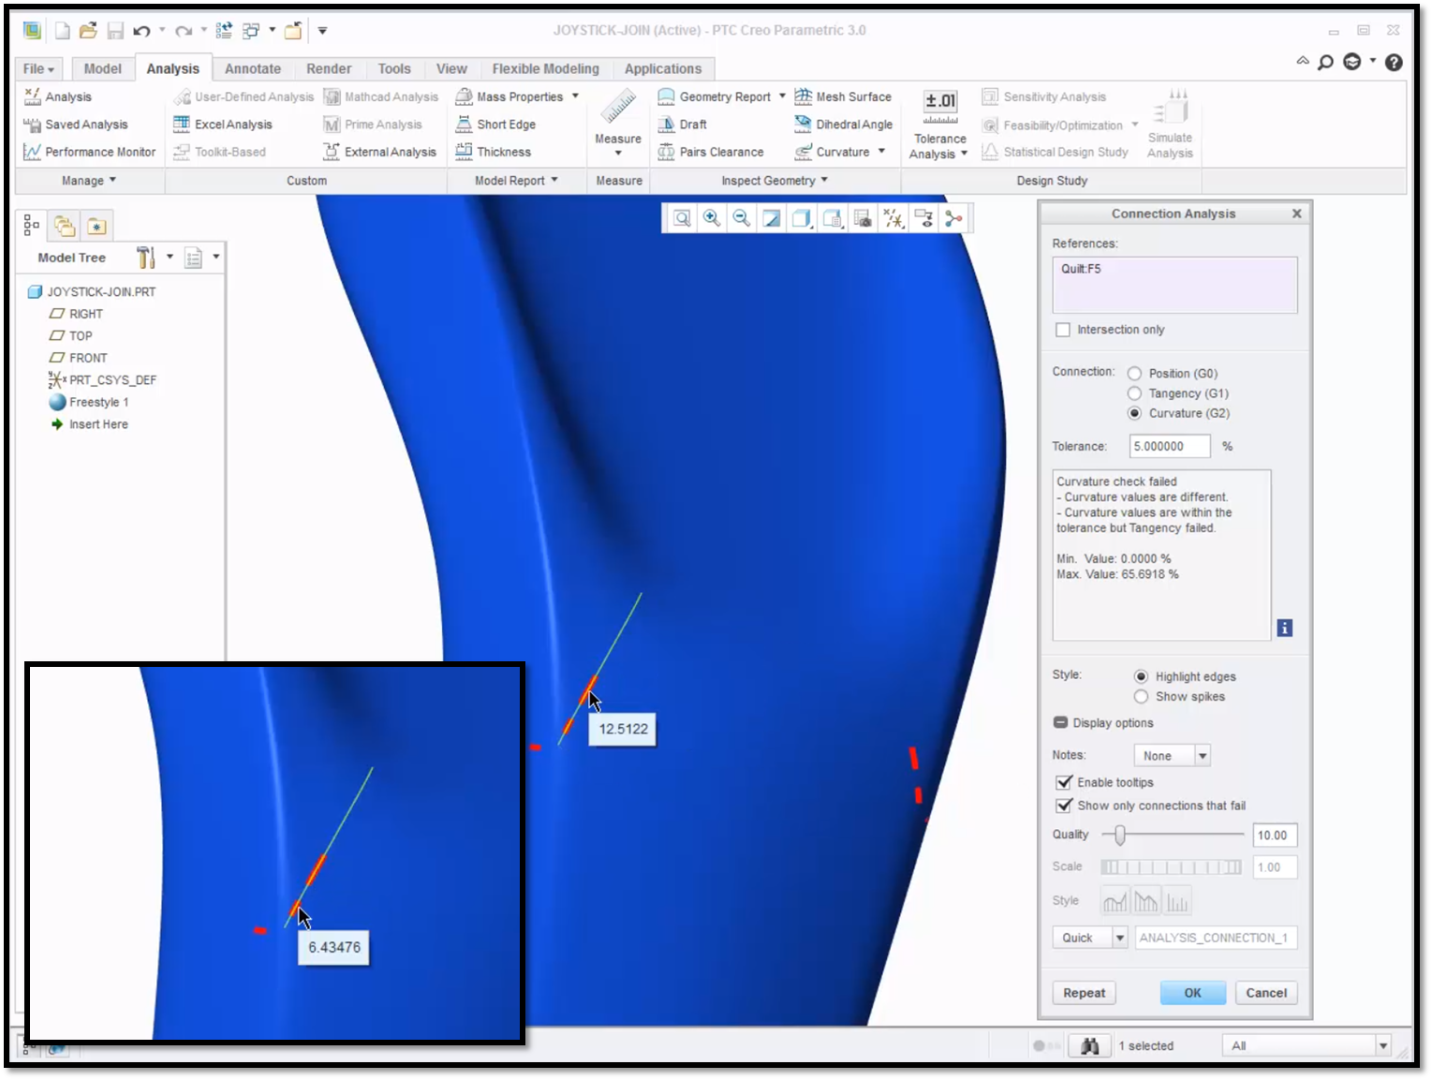
Here you can see that the value of the curvature is 12.5122 in one area and 6.43476 in another.
To learn more about evaluating connections in technical surfacing using PTC Creo, check out our video tutorial (Evaluating Connections in Technical Surfacing”).
Stay tuned to our “Did You Know” blog series as we cover all of the exciting, new enhancements in PTC Creo 3.0.
For more in-depth product feature explanations, visit our Tech Tips area.
Have some ideas about what PTC Creo product features you’d like to learn more about? Send me a message or leave a comment below and we’ll write up the best ideas from the community. Thanks for reading, looking forward to all of your feedback!
In case you missed it, see what’s new and check out our recent Did You Know posts covering PTC Creo 3.0 enhancements:
- Did You Know? Harness Manufacturing Extension
- Did You Know? PTC Creo Intelligent Fastener Extension
- Did You Know? PTC Creo 3.0 Enhancements: Performing a Design Study in PTC Creo Simulate
This thread is inactive and closed by the PTC Community Management Team. If you would like to provide a reply and re-open this thread, please notify the moderator and reference the thread. You may also use "Start a topic" button to ask a new question. Please be sure to include what version of the PTC product you are using so another community member knowledgeable about your version may be able to assist.
- Labels:
-
General


