Community Tip - New to the community? Learn how to post a question and get help from PTC and industry experts! X
- Subscribe to RSS Feed
- Mark Topic as New
- Mark Topic as Read
- Float this Topic for Current User
- Bookmark
- Subscribe
- Mute
- Printer Friendly Page
3D Plotting Problem, every axis with different units
- Mark as New
- Bookmark
- Subscribe
- Mute
- Subscribe to RSS Feed
- Permalink
- Notify Moderator
3D Plotting Problem, every axis with different units
Hi everyone,
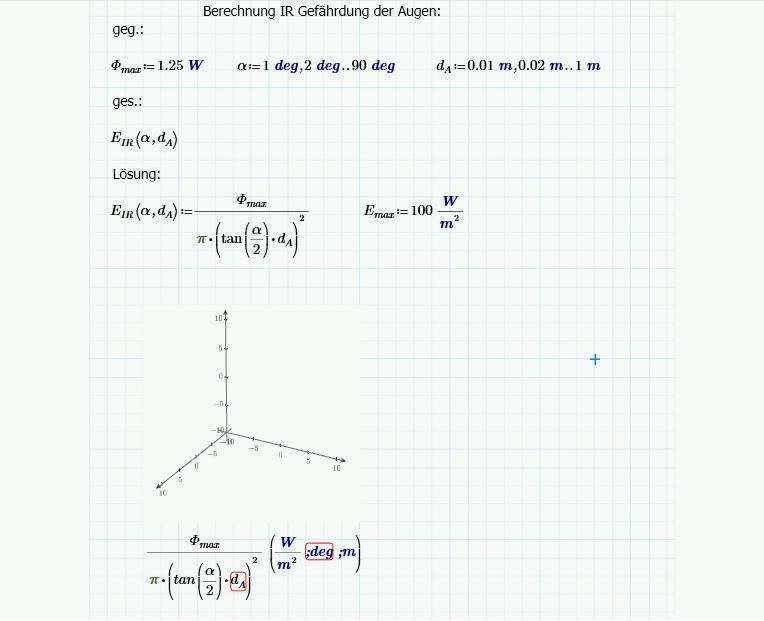
I have a Problem by 3d plotting a function.
Unfortunally I don't know what the problem is about, I have 3 unit types.
W / m²
m
deg
Z-Axis should be W / m²
x axis m
y axis deg
Could please anybody check my mathcad file and correct the error, or tell me what to do?
In the second step I need to insert a constant surface into the plot, with the value of 100 W / m².
I want to compare the curve from E.IR with the constant surface. Interesting is
every E.IR value which is above the limit of 100 W / m².
Thanks a lot for your help!
PS: Here you can see my worksheet, I also attached my mathcad file.

Best Regards,
Alexander
- Labels:
-
Other
- Mark as New
- Bookmark
- Subscribe
- Mute
- Subscribe to RSS Feed
- Permalink
- Notify Moderator
Hi Alexander,
Here is one way to achieve most of what you want.
The x & y axes will be scaled as metres & degrees , it just won't show on the plot.
Regards
Andy
- Mark as New
- Bookmark
- Subscribe
- Mute
- Subscribe to RSS Feed
- Permalink
- Notify Moderator
There was some crossposting on this isssue http://communities.ptc.com/message/219798#219798


