Community Tip - Want the oppurtunity to discuss enhancements to PTC products? Join a working group! X
- Subscribe to RSS Feed
- Mark Topic as New
- Mark Topic as Read
- Float this Topic for Current User
- Bookmark
- Subscribe
- Mute
- Printer Friendly Page
3D plot visualisation
- Mark as New
- Bookmark
- Subscribe
- Mute
- Subscribe to RSS Feed
- Permalink
- Notify Moderator
3D plot visualisation
Hello,
I am trying to do a 3d plot of an m x n matrix. I know that each point is plotted as an elevation on the z axe versus its respecctive row (x axis) and column y axis index. The values in the matrix are very diffrent, i mean i have -62 1.2 1 and 5.7 *10^9, and i don't find for example the poin (1,1,-62) on the plot. Is it because the max values are so diffrent from the min values? Thank you
- Labels:
-
Other
- Mark as New
- Bookmark
- Subscribe
- Mute
- Subscribe to RSS Feed
- Permalink
- Notify Moderator
Please post the worksheet. It's all but impossible to give you any advice without seeing the problem.
- Mark as New
- Bookmark
- Subscribe
- Mute
- Subscribe to RSS Feed
- Permalink
- Notify Moderator
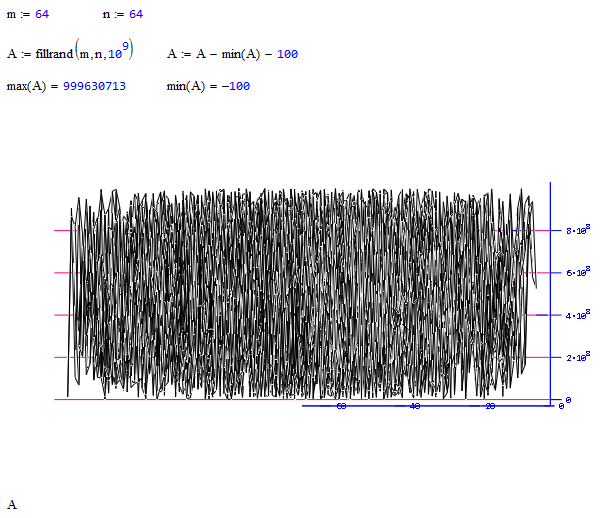
This is the data that i was talking about. I don't think that point is visible due to the differences between the max and min values.
- Mark as New
- Bookmark
- Subscribe
- Mute
- Subscribe to RSS Feed
- Permalink
- Notify Moderator
Iulia Savu wrote:
Hello,
I am trying to do a 3d plot of an m x n matrix. I know that each point is plotted as an elevation on the z axe versus its respecctive row (x axis) and column y axis index. The values in the matrix are very diffrent, i mean i have -62 1.2 1 and 5.7 *10^9, and i don't find for example the poin (1,1,-62) on the plot. Is it because the max values are so diffrent from the min values? Thank you
Very Likely.

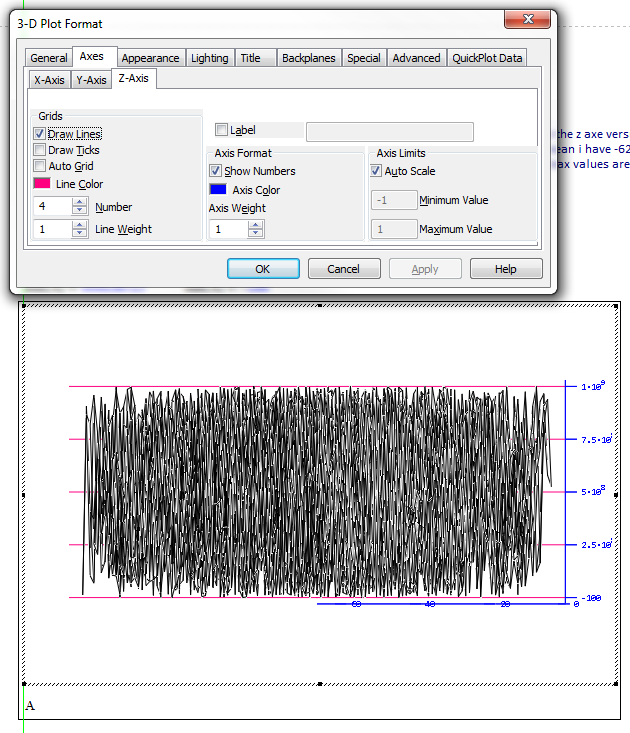
Can you manually set the lower limit in Prime? Here's what you get when you turn off Auto Grid in M15. You still can't really make out which values are the smallest, but at least you can see what the minimum value is.

Stuart
- Mark as New
- Bookmark
- Subscribe
- Mute
- Subscribe to RSS Feed
- Permalink
- Notify Moderator
Even if i set the lower limit to -70 lets say, i will still not be able to visualize the point due to the high diffrence.
- Mark as New
- Bookmark
- Subscribe
- Mute
- Subscribe to RSS Feed
- Permalink
- Notify Moderator
Hi Lulia.
Can try with a logarithmic scale, after translate for avoid nonpositive values.
Best regards.
Alvaro.
- Mark as New
- Bookmark
- Subscribe
- Mute
- Subscribe to RSS Feed
- Permalink
- Notify Moderator
> and i don't find for example the poin (1,1,-62) on the plot.
Possibly because its the point (0/0/-62). Indices run beginning from 0, not from 1, when ORIGIN is set (by default) to 0.
And this point of course looks like the origin (0/0/0) because -62 is so small compared to other values in your field.
- Mark as New
- Bookmark
- Subscribe
- Mute
- Subscribe to RSS Feed
- Permalink
- Notify Moderator
Yep, i think you are correct, ![]() Thanks for the help everyone.
Thanks for the help everyone.


