Community Tip - You can change your system assigned username to something more personal in your community settings. X
- Subscribe to RSS Feed
- Mark Topic as New
- Mark Topic as Read
- Float this Topic for Current User
- Bookmark
- Subscribe
- Mute
- Printer Friendly Page
Cubic Spline Interpolation
- Mark as New
- Bookmark
- Subscribe
- Mute
- Subscribe to RSS Feed
- Permalink
- Notify Moderator
Cubic Spline Interpolation
By Mathcad Staff
Interpolation in PTC Mathcad

About this worksheet:
- Displays how to use the various interpolation functions in PTC Mathcad
- Applicable to multiple disciplines
- Performs curve fitting, regression, interpolation, and cubic spline
This worksheet helps to differentiate between regression and interpolation. Regression is a mathematical process that attempts to find a best-fit curve through a set of data. Interpolation allows you to estimate values between measured data points. Interpolation is necessary with data that is described by an extremely complex function or data that can't be described by a function at all.
This worksheet discusses in-depth:
- Linear interpolation
- Cubic spline interpolation
- The interp Function
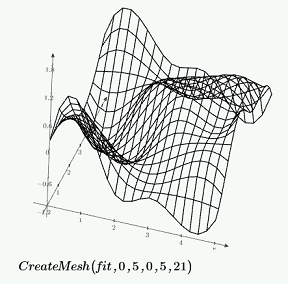
- The two-dimensional case
Linear interpolation is used when each data point is connected to the next by a straight line. You can use the linterp function in PTC Mathcad to work with this type of interpolation. You can also use the lspline, pspline, and cspline functions in PTC Mathcad when solving for polynomial splines.
This worksheet includes multiple examples for how to use various interpolation functions within Mathcad and includes step by step notation, descriptions, data sets, images and graphs, and solutions to help aid you.
Download and explore this worksheet yourself! You can download a free lifetime copy of PTC Mathcad Express and get 30 days of full functionality.
- Labels:
-
Statistics_Analysis


