
Turn on suggestions
Auto-suggest helps you quickly narrow down your search results by suggesting possible matches as you type.
Showing results for
Please log in to access translation
Turn on suggestions
Auto-suggest helps you quickly narrow down your search results by suggesting possible matches as you type.
Showing results for
Community Tip - Have a PTC product question you need answered fast? Chances are someone has asked it before. Learn about the community search. X
Translate the entire conversation x
Please log in to access translation
Options
- Subscribe to RSS Feed
- Mark Topic as New
- Mark Topic as Read
- Float this Topic for Current User
- Bookmark
- Subscribe
- Mute
- Printer Friendly Page
Developing IDF Curves from Rainfall Data
Apr 09, 2013
10:47 AM
- Mark as New
- Bookmark
- Subscribe
- Mute
- Subscribe to RSS Feed
- Permalink
- Notify Moderator
Please log in to access translation
Apr 09, 2013
10:47 AM
Developing IDF Curves from Rainfall Data
created by D.M. Griffin, Jr.
Determining Rainfall Amounts with a Specific Probability of Occurence
- Shows you how to use extreme value type 1 distribution and Gumbel distribution to find IDF curves for specific rainfall intensities
- Applicable to anyone trying to calculate IDF curves, specifically in environmental engineering and the sciences
- Performs using frequency analysis techniques, extreme value type 1 distribution, IDF curves, Excel, Gumbel, maximum depth equation, standard deviation, probability occurrence, intensity, IDF curve plot
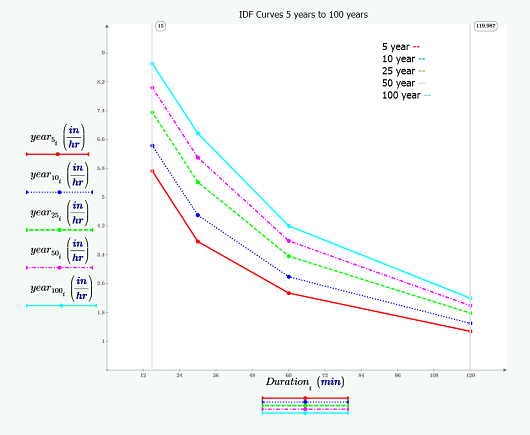
This worksheet using PTC Mathcad provides you with the data for twenty years of annual maximum rainfall depths for specified durations. The worksheet shows you how to use frequency analysis techniques (extreme value Type 1 distribution or Gumbel distribution) to find IDF curves for specific rainfall intensities. This worksheet uses data from an Excel spreadsheet within the PTC Mathcad file. Data are read from the spreadsheet, are manipulated in PTC Mathcad, and the IDF curves are plotted.
To begin, you are taught how to read the raw data from the Excel spreadsheet, attach the correct units, and compute the mean and standard deviation of each series. Next you are show how to compute the rainfall amount for each duration and return period using the equation given to you in the worksheet, the appropriate frequency factor, and intensity. To plot, you must place the intensity values in a matrix, along with the duration values. You are then able to plot the IDF curves from 5 to 100 years. In this problem the value of the rainfall amount that has a specified probability of occurrence was computed by assuming that the data followed a Type 1 Extreme value or Gumbel distribution.
This worksheet provides you with notation and step by step instruction for how to calculate the IDF curves from the annual rainfall data. All data, formulas, equations, solutions, and graphs are provided to aid you in your own calculations.
Download and explore this worksheet yourself! You can download a free lifetime copy of PTC Mathcad Express and get 30 days of full functionality.
Labels:
- Labels:
-
Statistics_Analysis
0 REPLIES 0


