Community Tip - Did you get called away in the middle of writing a post? Don't worry you can find your unfinished post later in the Drafts section of your profile page. X
- Subscribe to RSS Feed
- Mark Topic as New
- Mark Topic as Read
- Float this Topic for Current User
- Bookmark
- Subscribe
- Mute
- Printer Friendly Page
Filter data using comboboxes
- Mark as New
- Bookmark
- Subscribe
- Mute
- Subscribe to RSS Feed
- Permalink
- Notify Moderator
Filter data using comboboxes
Hi!
Is there a way to make a filter based on comboboxes ? i.e.
I want to be able to filter "Type" and "Version" so that the end result is a matrix i can plot
I used vlookup to easily filter "Type", but not sure how i can incoorporate the "Version" filter?
(I've attached my sheet, MCP 9)
Thank you!
Regards
SNA
Solved! Go to Solution.
- Labels:
-
Mathcad Usage
Accepted Solutions
- Mark as New
- Bookmark
- Subscribe
- Mute
- Subscribe to RSS Feed
- Permalink
- Notify Moderator
It looks to me that you are looking for a n x2 matrix as the result of the filtering!?
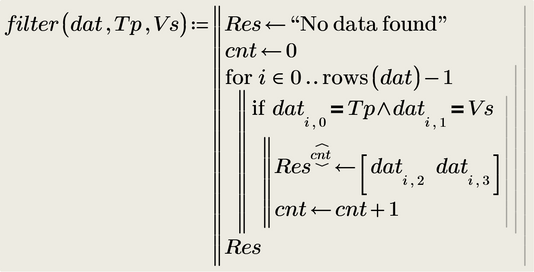
You may write a filter function like the one shown below
BTW, you had a typo in the version "A" in the first data row, there was an extra "
- Mark as New
- Bookmark
- Subscribe
- Mute
- Subscribe to RSS Feed
- Permalink
- Notify Moderator
Here is a different approach, a tricky one-liner
You may use try & catch for some error trapping
- Mark as New
- Bookmark
- Subscribe
- Mute
- Subscribe to RSS Feed
- Permalink
- Notify Moderator
Hi @Werner_E
Thank you so much!
Your first suggestion worked perfectly on a bigger data set i have 😁 Although i must confess i do not quite understand what is happening here:
I will also try your one-liner 🙂
Regards
SNA
- Mark as New
- Bookmark
- Subscribe
- Mute
- Subscribe to RSS Feed
- Permalink
- Notify Moderator
Yes, this approach is tricky and its "necessary" because Prime and Mathcad do not offer a structure like an empty array.
What the loop does is to collect all entries which fulfil both conditions.
Normally you would stack the new entry at the bottom of the ones already present via Res <-- stack(Res, [... ...]).
But the problem here is the first entry. On way around it would be to define a dummy row of Res in front of the loop (maybe column headers) and at the end you can decide if you want this headers be present or you cut them off using the submatrix function. If the array is only used for plotting, you may use a first row of NaN's.
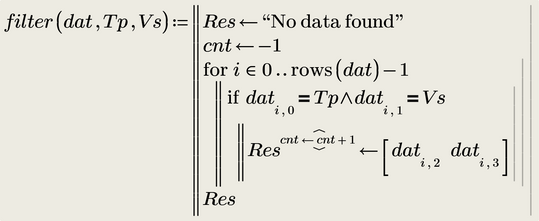
Here is a yet another way to create the desired matrix (without a header row). A counter variable is used to assign the rows.
You can save one line if you do the increment of the counter right in the row selector
Now for the explanation of my first suggestion. It benefits from the fact that the row( ) function returns a zero if its argument is a scalar or a string. And the method also uses the ORIGIN=0 setting and so the first time row(Res) returns 0 and so the first found values are inserted as row #0. Now the number of rows in Res is 1 and so the next entry is inserted as row #1 which means its the second row.
The function as I posted it assumes that you did not change the value of ORIGIN, but you can easily make it ORIGIN aware so it can be used in any sheet, no matter what its ORIGIN setting is.
Normally I would assign O <-- ORIGIN as the first line of the program and use O instead of ORIGIN


