
Turn on suggestions
Auto-suggest helps you quickly narrow down your search results by suggesting possible matches as you type.
Showing results for
Turn on suggestions
Auto-suggest helps you quickly narrow down your search results by suggesting possible matches as you type.
Showing results for
Community email notifications are disrupted. While we are working to resolve, please check on your favorite boards regularly to keep up with your conversations and new topics.
Options
- Subscribe to RSS Feed
- Mark Topic as New
- Mark Topic as Read
- Float this Topic for Current User
- Bookmark
- Subscribe
- Mute
- Printer Friendly Page
Help analyze data and biuld approximate diagrams
Mar 13, 2009
03:00 AM
- Mark as New
- Bookmark
- Subscribe
- Mute
- Subscribe to RSS Feed
- Permalink
- Notify Moderator
Mar 13, 2009
03:00 AM
Help analyze data and biuld approximate diagrams
I've uploaded excel worksheet
I've got table of experimental data (worksheets din1 and din2). there're diagrams build for this data on the "dinamic" sheet.
I need a series of similar graphics but for quite different input data. i checked two characteristic points on the plots - it's where two graphics start breaking up. As a result i want 'fake' graphics with quite similar random look (like a bit different peaks etc) i only care about characteristic points - start Y value and X value where graphics start breaking up.
Can i get dependences i need from this data ?
Labels:
- Labels:
-
Statistics_Analysis
12 REPLIES 12
Mar 13, 2009
03:00 AM
- Mark as New
- Bookmark
- Subscribe
- Mute
- Subscribe to RSS Feed
- Permalink
- Notify Moderator
Mar 13, 2009
03:00 AM
Your Excel work sheet does not contain any data that could be captured. Can't scroll, can't reduce, nothing usable. The best is to make table(s) of the data in a Mathcad input table, "save as" 11 or lower versions.
jmG
jmG
Mar 13, 2009
03:00 AM
- Mark as New
- Bookmark
- Subscribe
- Mute
- Subscribe to RSS Feed
- Permalink
- Notify Moderator
Mar 13, 2009
03:00 AM
Pretty easy to create an Excel component with your sheet and reproduce the graphs (I've done one of them). But I beyond that I don't know what you want. I have no idea what a fake graph is, Mathcad graphs data.
There's an anomaly with the time base -- there seems to be some discontinuity and changes between the two sheets. Very odd.
__________________
� � � � Tom Gutman
There's an anomaly with the time base -- there seems to be some discontinuity and changes between the two sheets. Very odd.
__________________
� � � � Tom Gutman
Mar 17, 2009
03:00 AM
- Mark as New
- Bookmark
- Subscribe
- Mute
- Subscribe to RSS Feed
- Permalink
- Notify Moderator
Mar 17, 2009
03:00 AM
I cleared all the unneeded data from excel sheet (can't get why it's still that big), imported data into mathcad, built diagrams. it's easy. all the files are stored in the rar archieve.
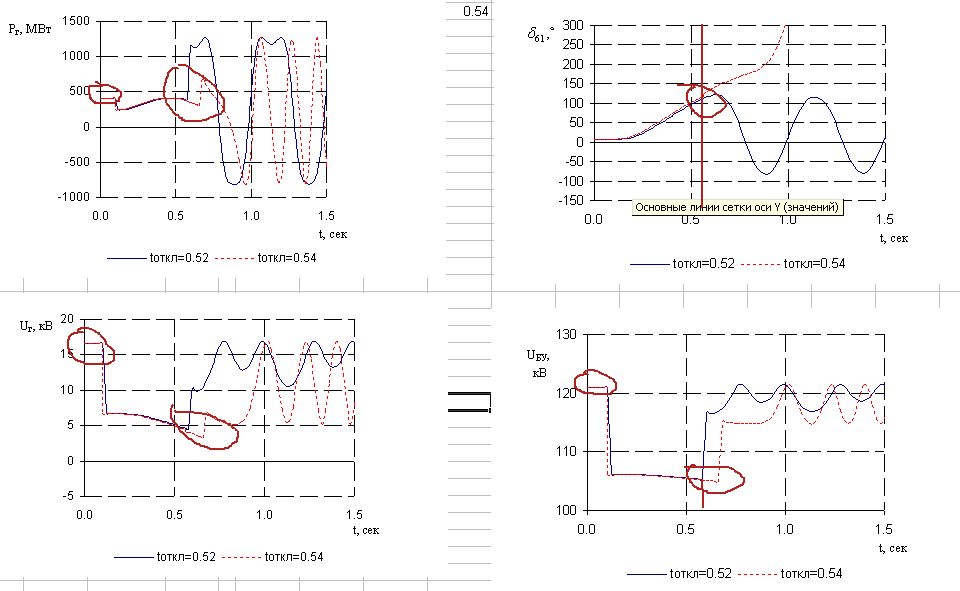
notice X-marker on the diagrams - that is known 'key point'. this is where diagrams begin to vary greatly.
Now the problem: i need new data tables/diagrams for another case. For this i need diagrams like the ones i have but known key-point is different. not 0.6 but 1.1 for ex. i tried to make a sketch for above right diagram in the lower right corner. hope you'll get what i mean
.jpg)
notice X-marker on the diagrams - that is known 'key point'. this is where diagrams begin to vary greatly.
Now the problem: i need new data tables/diagrams for another case. For this i need diagrams like the ones i have but known key-point is different. not 0.6 but 1.1 for ex. i tried to make a sketch for above right diagram in the lower right corner. hope you'll get what i mean
Mar 17, 2009
03:00 AM
- Mark as New
- Bookmark
- Subscribe
- Mute
- Subscribe to RSS Feed
- Permalink
- Notify Moderator
Mar 17, 2009
03:00 AM
Attach the Mathcad work sheet *.MCD
"Saves as" version 11 or lower.
*.RAR is a compressed format that compresses mostly text.
It probably compressed nothing vs the native sheet.
jmG
"Saves as" version 11 or lower.
*.RAR is a compressed format that compresses mostly text.
It probably compressed nothing vs the native sheet.
jmG
Mar 18, 2009
03:00 AM
- Mark as New
- Bookmark
- Subscribe
- Mute
- Subscribe to RSS Feed
- Permalink
- Notify Moderator
Mar 18, 2009
03:00 AM
On 3/17/2009 8:33:55 PM, jmG wrote:
>Attach the Mathcad work sheet
>*.MCD
>"Saves as" version 11 or
>lower.
>*.RAR is a compressed format
>that compresses mostly text.
>It probably compressed nothing
>vs the native sheet.
>
>jmG
>
there's xls inside too 😉 just open the archieve
>Attach the Mathcad work sheet
>*.MCD
>"Saves as" version 11 or
>lower.
>*.RAR is a compressed format
>that compresses mostly text.
>It probably compressed nothing
>vs the native sheet.
>
>jmG
>
there's xls inside too 😉 just open the archieve
Mar 18, 2009
03:00 AM
- Mark as New
- Bookmark
- Subscribe
- Mute
- Subscribe to RSS Feed
- Permalink
- Notify Moderator
Mar 18, 2009
03:00 AM
I've attached worksheet again if rar archiweve is that big problem 🙂
Mar 18, 2009
03:00 AM
- Mark as New
- Bookmark
- Subscribe
- Mute
- Subscribe to RSS Feed
- Permalink
- Notify Moderator
Mar 18, 2009
03:00 AM
Sorry, I cannot see your MC sheets 'cause my version of MC is very old, so I'm not sure what are you trying to do.
Have you considered the possibility of determining the delta-x and/or delta-y changes in sucesive (x,y) pairs and flagging when any of those values exceed some predefined tolerance?
Have you considered the possibility of determining the delta-x and/or delta-y changes in sucesive (x,y) pairs and flagging when any of those values exceed some predefined tolerance?
Mar 18, 2009
03:00 AM
- Mark as New
- Bookmark
- Subscribe
- Mute
- Subscribe to RSS Feed
- Permalink
- Notify Moderator
Mar 18, 2009
03:00 AM
RAR archives are not a big problem. But most people have not purchased the RAR archive package and so cannot unpack them. Not a big problem as they don't show up much (ZIP format is pretty much the standard for archives, supported by PKZIP, WINZIP, and, to some extent, Windows itself.
You plots don't look right when using your previously posted Excel sheet. If this Mathcad sheet goes with a different Excel file, you need to include that file. Easiest (for the collabs) is to embed it as an Excel component. Or post it, and set the sheet to read the posted file.
But still, what is the problem? If you have another data set to plot, just plot it. AFAICT the critical points are determined by eye anyway.
__________________
� � � � Tom Gutman
Mar 18, 2009
03:00 AM
- Mark as New
- Bookmark
- Subscribe
- Mute
- Subscribe to RSS Feed
- Permalink
- Notify Moderator
Mar 18, 2009
03:00 AM
On 3/18/2009 2:26:16 PM, Tom_Gutman wrote:
>RAR archives are not a big
>problem. But most people have
>not purchased the RAR archive
>package and so cannot unpack
>them.
I recommend this program:
http://www.filzip.com/
It's completely free, and supports many archive types.
Richard
>RAR archives are not a big
>problem. But most people have
>not purchased the RAR archive
>package and so cannot unpack
>them.
I recommend this program:
http://www.filzip.com/
It's completely free, and supports many archive types.
Richard
Mar 18, 2009
03:00 AM
- Mark as New
- Bookmark
- Subscribe
- Mute
- Subscribe to RSS Feed
- Permalink
- Notify Moderator
Mar 18, 2009
03:00 AM
On 3/18/2009 1:26:07 PM, bdfy wrote:
>I've attached worksheet again
>if rar archiweve is that big
>problem 🙂
>____________________________
Make Mathcad input tables, so you can forget the Excel. If there is Mathcad work to be done, then Mathcad work sheet only.
jmG
>I've attached worksheet again
>if rar archiweve is that big
>problem 🙂
>____________________________
Make Mathcad input tables, so you can forget the Excel. If there is Mathcad work to be done, then Mathcad work sheet only.
jmG
Mar 18, 2009
03:00 AM
- Mark as New
- Bookmark
- Subscribe
- Mute
- Subscribe to RSS Feed
- Permalink
- Notify Moderator
Mar 18, 2009
03:00 AM
xls and mcd ver. 11 together
Input: i have this data/plots. i suppose it's possible to get data change dependence from it.
i have another keypoint (see the picture i posted) - not 0.6 but 1.1 for ex.
I want data tables/plots that behave alike, so i can see abother key-point i want on the diagrams
kinda 'fake' data tables.
The easiest solution is just scratch/compress diagrams in X-direction - but it looks stratched then 🙂 thus i need to get some basic dependences to make plots that look right
off: btw, rar archieves are five times more effective with my package... and it's supported by free 7-zip too
Mar 18, 2009
03:00 AM
- Mark as New
- Bookmark
- Subscribe
- Mute
- Subscribe to RSS Feed
- Permalink
- Notify Moderator
Mar 18, 2009
03:00 AM
Not that way:
No *.zip that zips nothing in work sheets, no *.RAR
Only the Mathcad work sheet *.MCD
jmG
No *.zip that zips nothing in work sheets, no *.RAR
Only the Mathcad work sheet *.MCD
jmG


.jpg)