Community Tip - Stay updated on what is happening on the PTC Community by subscribing to PTC Community Announcements. X
- Subscribe to RSS Feed
- Mark Topic as New
- Mark Topic as Read
- Float this Topic for Current User
- Bookmark
- Subscribe
- Mute
- Printer Friendly Page
How do I draw a surface, expressed in polar coordinates?
- Mark as New
- Bookmark
- Subscribe
- Mute
- Subscribe to RSS Feed
- Permalink
- Notify Moderator
How do I draw a surface, expressed in polar coordinates?
Hello,
I have a circular symmetry system. A physical quantity defined in the circular section of such a system is defined by a function of the two polar variables r and φ. How to have the graph of this surface using CreateMesh () and pol2xy ()? I find some difficulties, maybe trying and trying again I succeed. But I would like your suggestion so as not to waste time. The function, in polar coordinates, is for example F (r, φ) = Jn (1,0.383r) cos (φ).
Solved! Go to Solution.
Accepted Solutions
- Mark as New
- Bookmark
- Subscribe
- Mute
- Subscribe to RSS Feed
- Permalink
- Notify Moderator
- Mark as New
- Bookmark
- Subscribe
- Mute
- Subscribe to RSS Feed
- Permalink
- Notify Moderator
I'm sorry. Problem solved.
- Mark as New
- Bookmark
- Subscribe
- Mute
- Subscribe to RSS Feed
- Permalink
- Notify Moderator
- Tags:
- Prime_6.0
- Mark as New
- Bookmark
- Subscribe
- Mute
- Subscribe to RSS Feed
- Permalink
- Notify Moderator
- Mark as New
- Bookmark
- Subscribe
- Mute
- Subscribe to RSS Feed
- Permalink
- Notify Moderator
Some remarks:
- You can get rid of the if-function in the definition of F.z because Mathcad#s 3D plot won't accept NaN's anyway and would throw an error
- Using atan(y/x) gives you wrong results (wrong sign) for x<0 and an error if x=0 (try Bound:=101)
You should use atan2(x,y) instead - To avoid an error if your mesh includes x=y=0 you should create an error trapping Atan2 function which returns 0 if x=y=0.
- Mark as New
- Bookmark
- Subscribe
- Mute
- Subscribe to RSS Feed
- Permalink
- Notify Moderator
One additional remark because you asked how to use CreateMesh with a mapping function like pol2xy.
You can't use pol2xy as this mapping function only works in 2D.
You are dealing with cylinder coordinates and so you will have to use the predefined cyl2xyz() -> see F2
Of course you always can define your own mapping function, too -> see F3
Of course the 3D plots with F2 and F2 are limited to a circular base area in the xy-plane as they are dealing directly with the original polar coordinates in xy, while F1 has a rectangular base in the xy-plane.
But in your initial question you wrote "A physical quantity defined in the circular section" and so I was irritated that your solution used a rectangular/square section instead.
- Mark as New
- Bookmark
- Subscribe
- Mute
- Subscribe to RSS Feed
- Permalink
- Notify Moderator
Thanks, Werner
You are a master of arts, you have all my admiration, esteem, and affection.
- Mark as New
- Bookmark
- Subscribe
- Mute
- Subscribe to RSS Feed
- Permalink
- Notify Moderator
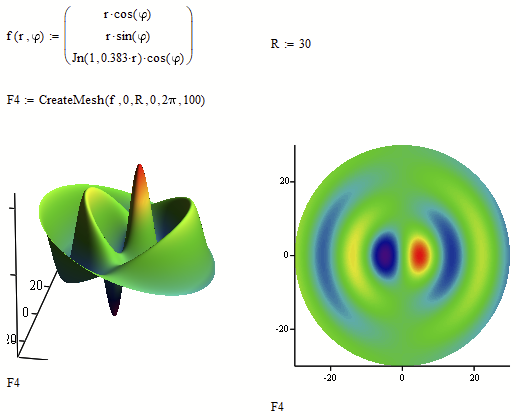
Here's another way doing it without using a mapping function in CreateMesh by defining the base function not as R^2 -> R but rather R^2-> R^3.
Of course this just means to manually apply the mapping function when defining f(r,phi). So the most convenient way is letting CreateMesh do the job using the built-in cyl2xyz mapping function (as shown above, F2). Personally I'd prefer F4 as it dispplays more clearly what's going on under the hood.
- Mark as New
- Bookmark
- Subscribe
- Mute
- Subscribe to RSS Feed
- Permalink
- Notify Moderator
Hi Werner,
Could you give me a practical example of 3D design of isocline using the same function defined constant moving on z. Like the isotherms in a metal bar but in the z direction?
- Mark as New
- Bookmark
- Subscribe
- Mute
- Subscribe to RSS Feed
- Permalink
- Notify Moderator
@-MFra- wrote:
Hi Werner,
Could you give me a practical example of 3D design of isocline using the same function defined constant moving on z. Like the isotherms in a metal bar but in the z direction?
I am not sure if I understand what you are asking for. The isoclines you see can be drawn by selecting "Contour Lines" instead of "Wireframe" in the 3D-Plot Format menu / "Appearance".
But I guess thats not what you wanted to know?
- Mark as New
- Bookmark
- Subscribe
- Mute
- Subscribe to RSS Feed
- Permalink
- Notify Moderator
Maybe a sketch is worth a thousand words ....
In fact something is missing .... I will complete tomorrow ...
- Mark as New
- Bookmark
- Subscribe
- Mute
- Subscribe to RSS Feed
- Permalink
- Notify Moderator
@-MFra- wrote:
Maybe a sketch is worth a thousand words ....
Thats true in many cases, but in this one, unfortunately .., no
I am not sure what kind of mapping between cylindrical and cartesian coordinates you are referring to with those arrows. Maybe you can explain in math terms an/or provide a simple example of the searched for plot.


