Community Tip - Did you get an answer that solved your problem? Please mark it as an Accepted Solution so others with the same problem can find the answer easily. X
- Subscribe to RSS Feed
- Mark Topic as New
- Mark Topic as Read
- Float this Topic for Current User
- Bookmark
- Subscribe
- Mute
- Printer Friendly Page
How to display a point on 3D Plot in Mathcad Prime?
- Mark as New
- Bookmark
- Subscribe
- Mute
- Subscribe to RSS Feed
- Permalink
- Notify Moderator
How to display a point on 3D Plot in Mathcad Prime?
Hello,
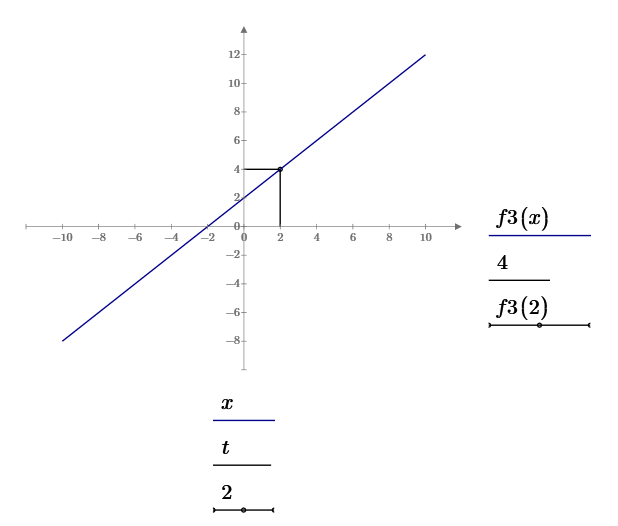
For 2D Plot:
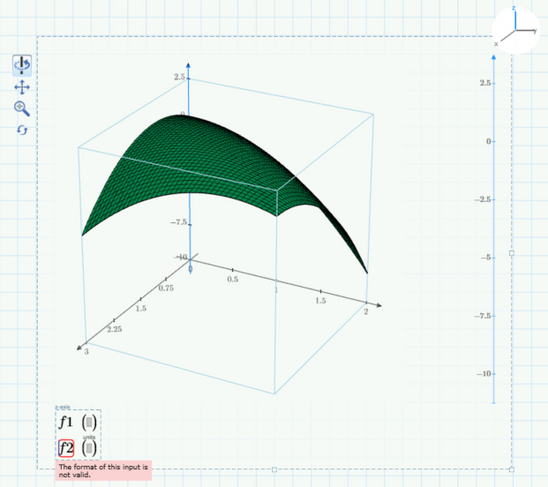
For 3D Plot:
I want to plot the point f1(2,1)=2, so the point where x=2 and y=1 on the 3D plot, and to display the point as it is showed in 2D Plot.
Is it possible to do this?
Mathcad Prime 8 file attached.
Thank you.
Solved! Go to Solution.
- Labels:
-
Calculus_Derivatives
-
Mathcad Usage
Accepted Solutions
- Mark as New
- Bookmark
- Subscribe
- Mute
- Subscribe to RSS Feed
- Permalink
- Notify Moderator
Points can be plotted as a 3-column [ x, y, z ] matrix. However, there have to be at least two rows in the matrix. So, for your case, just repeat the same point twice as shown below. Then change the Plot parameters for the Matrix to be points, no lines, a contrasting color, and increased line thickness. Like this:
- Mark as New
- Bookmark
- Subscribe
- Mute
- Subscribe to RSS Feed
- Permalink
- Notify Moderator
The easiest way was already shown by Jeff.
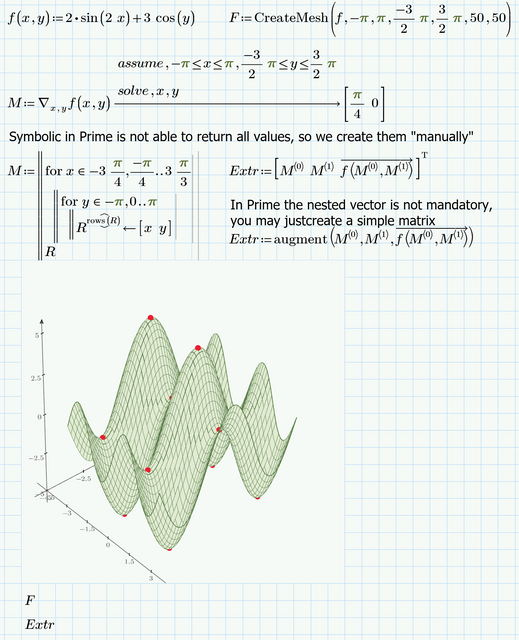
A bit more elaborate is to create a constant vector function and use it for plotting 😉
You may also use "CreateSpace" to create a structure similar to what Jeff had created "by hand". Its a nested vector, though.
A nested vector like this was the only way you could plot a polygon in MC15, but that version would allow for a single point as well.
It may be see as a bug that Prime needs to double that single point. On the other hand its nice that we can use a simple matrix in Prime and don't necessarily need that nested structure.
EDIT:
Of course you don't need to double the point coordinates if you plot more than one point in one go
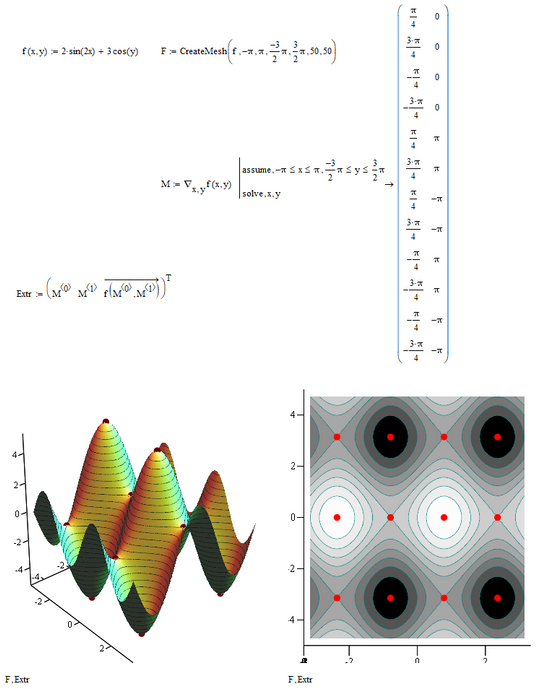
Es you can see the new symbolic in Prime is not able to deliver all zeros asked for, so I had to create the matrix which "solve" should have returned manually.
Here is what it looks like in Mathcad
- Mark as New
- Bookmark
- Subscribe
- Mute
- Subscribe to RSS Feed
- Permalink
- Notify Moderator
I do not understand this M of how we create all the values "manually".
What exactly does this M program do?
let's take two examples:
And the second example:
- Mark as New
- Bookmark
- Subscribe
- Mute
- Subscribe to RSS Feed
- Permalink
- Notify Moderator
And the third example:
M7(x,y) := 2*y+(2-2*x) , -2*π<=x<=2*π, -π<=y<=π
How this program of M will look like?
- Mark as New
- Bookmark
- Subscribe
- Mute
- Subscribe to RSS Feed
- Permalink
- Notify Moderator
@Cornel wrote:
I do not understand this M of how we create all the values "manually".
What exactly does this M program do?
No magic, just simple math.
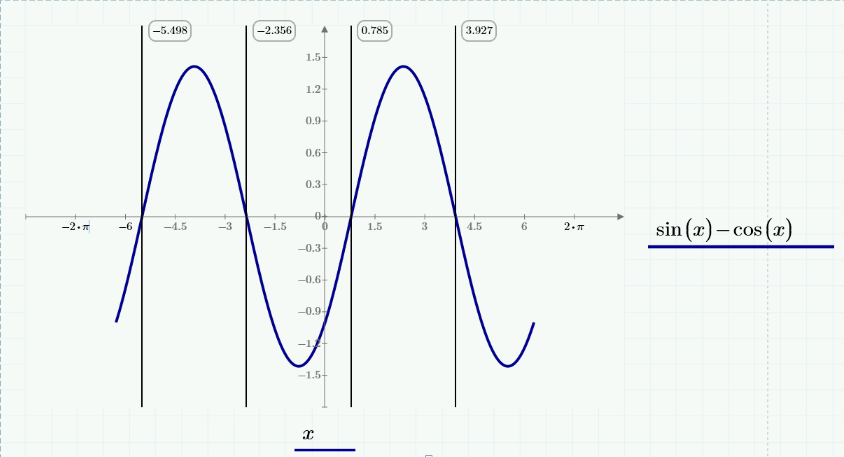
You don't need a CAS to see that the partial derivate after x vanishes for all x=pi/4+k*pi/2 (k being an integer) and the partial derivative after y vanishes if y is a multiple of pi. The program simply creates a matrix with all combinations needed for plotting.
So M contains the very same values (in a different order, though) as the matrix M created automatically by real Mathcad.
BTW, the last value in the loop for x has a typo - it should be 2*pi/4 rather than 3*pi/3.
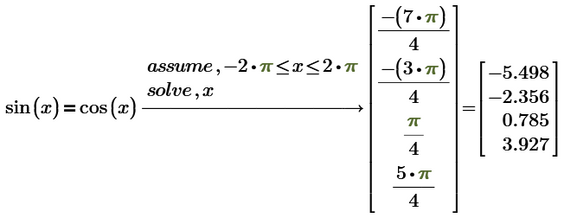
If you need help with the derivates and zeros, then even the symbolic in Prime can do it for you 🙂
Prime can even give you the concrete values you need
So all you have to do is creating a matrix with all 12 combinations of values out of these two vectors, as Prime is not able to do so in contrary to old Mathcad,
- Mark as New
- Bookmark
- Subscribe
- Mute
- Subscribe to RSS Feed
- Permalink
- Notify Moderator


