
Turn on suggestions
Auto-suggest helps you quickly narrow down your search results by suggesting possible matches as you type.
Showing results for
Please log in to access translation
Turn on suggestions
Auto-suggest helps you quickly narrow down your search results by suggesting possible matches as you type.
Showing results for
Community Tip - When posting, your subject should be specific and summarize your question. Here are some additional tips on asking a great question. X
Translate the entire conversation x
Please log in to access translation
Options
- Subscribe to RSS Feed
- Mark Topic as New
- Mark Topic as Read
- Float this Topic for Current User
- Bookmark
- Subscribe
- Mute
- Printer Friendly Page
How to plot the two equations
Sep 11, 2015
09:32 PM
- Mark as New
- Bookmark
- Subscribe
- Mute
- Subscribe to RSS Feed
- Permalink
- Notify Moderator
Please log in to access translation
Sep 11, 2015
09:32 PM
How to plot the two equations
Hi,
I want to plot the 2 equations in mathcad,
The two equations are,
2x^2+3y^2=59 (circle)
4y=x+8 (straight line)
these examples are used in Find command in mathcad.
I attached my code below.
Solved! Go to Solution.
Labels:
- Labels:
-
Other
ACCEPTED SOLUTION
Accepted Solutions
Sep 12, 2015
08:29 AM
- Mark as New
- Bookmark
- Subscribe
- Mute
- Subscribe to RSS Feed
- Permalink
- Notify Moderator
Please log in to access translation
Sep 12, 2015
08:29 AM
I want to plot the 2 equations in mathcad,
The problem is that Mathcad unfortunately is not able to plot implicit function. So you have to provide explicit functions or turn the equation into a parametric representation.
2x^2+3y^2=59 (circle)
Thats definitely not a circle but an ellipse!
these examples are used in Find command in mathcad.
Find uses an numeric algorithm an will only give you just one solution (depending on the guess values). Sometimes you have luck and the symbolic solve command will give you all solutions.
Here is a variation using just the symbolics (be aware that Mathcad's symbolic abilities are rather limited).

As you can see the ellipse is drawn as two plots (upper and lower half) and I have used a rather dense range variable x_ for plotting to avoid bigger gaps at the joints.
For plotting ellipses its much better to use a parametric representation which I guess cannot be found automatically but of course is well known for an ellipse.
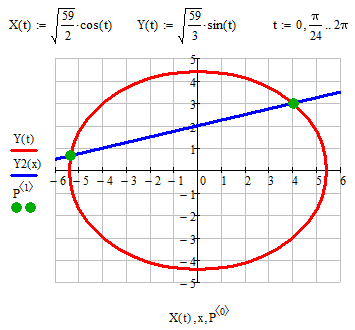
Regards, Werner
2 REPLIES 2
Sep 12, 2015
03:25 AM
- Mark as New
- Bookmark
- Subscribe
- Mute
- Subscribe to RSS Feed
- Permalink
- Notify Moderator
Please log in to access translation
Sep 12, 2015
08:29 AM
- Mark as New
- Bookmark
- Subscribe
- Mute
- Subscribe to RSS Feed
- Permalink
- Notify Moderator
Please log in to access translation
Sep 12, 2015
08:29 AM
I want to plot the 2 equations in mathcad,
The problem is that Mathcad unfortunately is not able to plot implicit function. So you have to provide explicit functions or turn the equation into a parametric representation.
2x^2+3y^2=59 (circle)
Thats definitely not a circle but an ellipse!
these examples are used in Find command in mathcad.
Find uses an numeric algorithm an will only give you just one solution (depending on the guess values). Sometimes you have luck and the symbolic solve command will give you all solutions.
Here is a variation using just the symbolics (be aware that Mathcad's symbolic abilities are rather limited).
As you can see the ellipse is drawn as two plots (upper and lower half) and I have used a rather dense range variable x_ for plotting to avoid bigger gaps at the joints.
For plotting ellipses its much better to use a parametric representation which I guess cannot be found automatically but of course is well known for an ellipse.
Regards, Werner


