Community Tip - Did you know you can set a signature that will be added to all your posts? Set it here! X
- Subscribe to RSS Feed
- Mark Topic as New
- Mark Topic as Read
- Float this Topic for Current User
- Bookmark
- Subscribe
- Mute
- Printer Friendly Page
Loop to plot
- Mark as New
- Bookmark
- Subscribe
- Mute
- Subscribe to RSS Feed
- Permalink
- Notify Moderator
Loop to plot
Can I loop the function to solve and plot the equation in prime?
Solved! Go to Solution.
- Labels:
-
Mathcad Usage
Accepted Solutions
- Mark as New
- Bookmark
- Subscribe
- Mute
- Subscribe to RSS Feed
- Permalink
- Notify Moderator
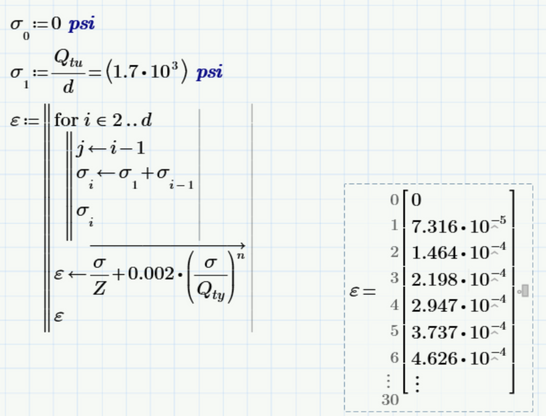
Something like this?
You have to use matrix indices when defining sigma.0 and sigma.1 and add the unit, even if the value is zero.
(vectorization isn't necessary here as but a good habit to explicitly apply)
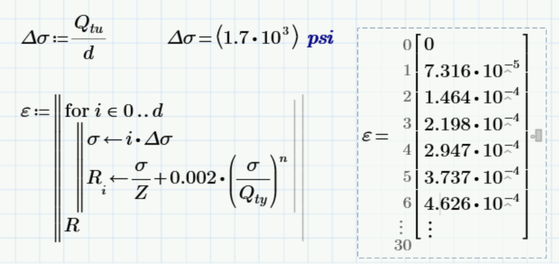
Of course the same effect could be achieved easier
- Mark as New
- Bookmark
- Subscribe
- Mute
- Subscribe to RSS Feed
- Permalink
- Notify Moderator
Is there any specific reason why I am only getting two values for returning sigma
- Mark as New
- Bookmark
- Subscribe
- Mute
- Subscribe to RSS Feed
- Permalink
- Notify Moderator
As an afterthought I overlooked that you can/should delete the last single sigma_i in the for loop as it has no effect. There is also no need for "j" which is never used.
@JB_10220769 wrote:
Is there any specific reason why I am only getting two values for returning sigma
Yes, its because you defined a FUNCTION epsilon(..), not a simple variable epsilon as i did. This function is never called and so sigma consists of the two values you manually assigned.
Note that nothing you change inside a program can change anything on worksheet level, even if the variable has the very same name (like sigma in your case). Only way to change a worksheet variable with a program is via the return value and the names of the (local) variables in the program dos not matter. They must not be the same as the variables in the worksheet.
If you really need a function because you intend to call it with different initial values sigma[1, you should define it as epsilon(delta) and not of delta[i. But I guess you just want the variable epsilon as a vector.
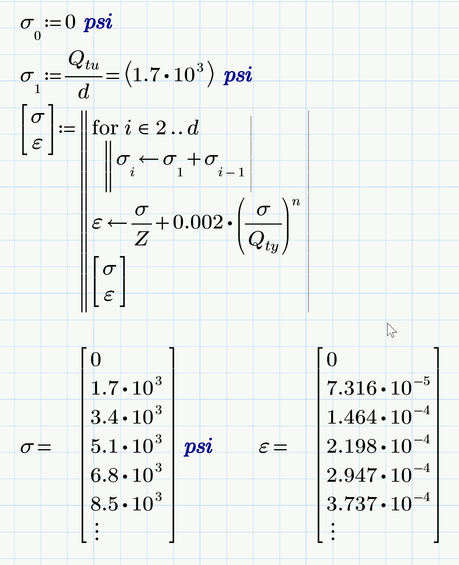
I see that you obviously do not just want a vector epsilon but also the corresponding vector delta, right?
You can do it that way
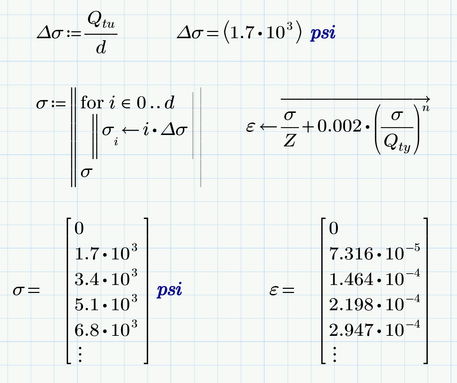
or I would prefer this
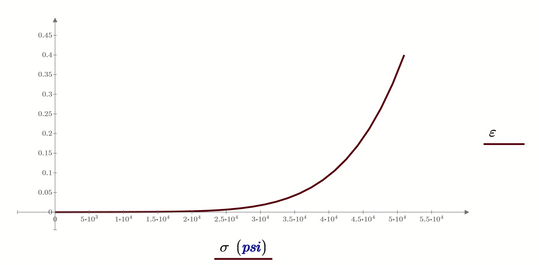
And of course you may plot epsilon over sigma if you like
P6 worksheet attached

