- Subscribe to RSS Feed
- Mark Topic as New
- Mark Topic as Read
- Float this Topic for Current User
- Bookmark
- Subscribe
- Mute
- Printer Friendly Page
MathCAD phase starts from circa -80 instead -270 deg
- Mark as New
- Bookmark
- Subscribe
- Mute
- Subscribe to RSS Feed
- Permalink
- Notify Moderator
MathCAD phase starts from circa -80 instead -270 deg
Hi all,
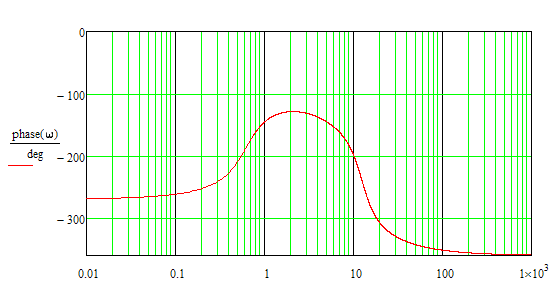
Its me again ![]() . I dont know how is it possible but when I make a bode plot in mathCAD phase is starting from different value than it is supposed to. Look into file. The phase should start at -270 like on the diagram from matlab. What could be wrong?
. I dont know how is it possible but when I make a bode plot in mathCAD phase is starting from different value than it is supposed to. Look into file. The phase should start at -270 like on the diagram from matlab. What could be wrong?
- Mark as New
- Bookmark
- Subscribe
- Mute
- Subscribe to RSS Feed
- Permalink
- Notify Moderator
arg() will give you values in the range of -180° to +180°. So you will never get -270° but rather +90°. If you want the values in the range (-360°; 0°] you could simply subtract 180 to phase().
BTW, shouldn't you comment on and so close a previous question?
- Mark as New
- Bookmark
- Subscribe
- Mute
- Subscribe to RSS Feed
- Permalink
- Notify Moderator
Of course. I will do that.
And can you suggest another function that will give bigger range? Thank you
- Mark as New
- Bookmark
- Subscribe
- Mute
- Subscribe to RSS Feed
- Permalink
- Notify Moderator
And can you suggest another function that will give bigger range?
This wouldn't be a function but just a relation as of the ambiguity. And what result would you expect for -1-1j? Mathcad's arg() will give you -3pi/4 (-135°), but of course you may add/subtract any integer multiple of 2pi (360°).
You may change the desired range (still of length 360°) using an if. Furthermore there is a change in sign which I have not really corrected with the change in phase. Also w shoul have a smaller step width.
See if the attached helps.

EDIT: Now the attachment should ber there, too.
- Mark as New
- Bookmark
- Subscribe
- Mute
- Subscribe to RSS Feed
- Permalink
- Notify Moderator


