
Turn on suggestions
Auto-suggest helps you quickly narrow down your search results by suggesting possible matches as you type.
Showing results for
Please log in to access translation
Turn on suggestions
Auto-suggest helps you quickly narrow down your search results by suggesting possible matches as you type.
Showing results for
Community Tip - Learn all about the Community Ranking System, a fun gamification element of the PTC Community. X
Translate the entire conversation x
Please log in to access translation
Options
- Subscribe to RSS Feed
- Mark Topic as New
- Mark Topic as Read
- Float this Topic for Current User
- Bookmark
- Subscribe
- Mute
- Printer Friendly Page
Mathcad 2.x and 3.x Boxplot issue
Mar 08, 2017
05:32 AM
- Mark as New
- Bookmark
- Subscribe
- Mute
- Subscribe to RSS Feed
- Permalink
- Notify Moderator
Please log in to access translation
Mar 08, 2017
05:32 AM
Mathcad 2.x and 3.x Boxplot issue
Hello Guys,
i got a question, maybe im doing something wrong but....
When i try to use the function boxplot(Data) the Q1 and Q3 are wrong. But the Median is right.
Example:
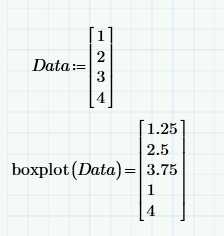
Q1 = 1.25 and Q3=3.75
BUT
Q1 should be 1.5 and Q3 should be 3.5, am i wrong?
Q1= (1+2)/2 = 2.5 and Q3=(3+4)2=3.5
If you want to see it in Mathcad, its in the Attach
Thanks and regards
Samuel
Labels:
- Labels:
-
Statistics_Analysis
4 REPLIES 4
Mar 08, 2017
07:14 AM
- Mark as New
- Bookmark
- Subscribe
- Mute
- Subscribe to RSS Feed
- Permalink
- Notify Moderator
Please log in to access translation
Mar 08, 2017
07:14 AM
There are multiple methods to calculate the quartiles. See Quartile - Wikipedia.
The question is what definition Prime uses.
Luc
Mar 08, 2017
07:43 AM
- Mark as New
- Bookmark
- Subscribe
- Mute
- Subscribe to RSS Feed
- Permalink
- Notify Moderator
Please log in to access translation
Mar 08, 2017
07:43 AM
But none of the three methods described by Wikipedia results in Q1=1.25 and Q3=3.75.
Also note that the median is not the average. The median is that value that divides the set of numbers into two equally large sets.
So the median of the example set of values is 2.5, not because (2+3)/2=2.5, but because two values lie below 2.5 and two values lie above it.
In fact, for this set, the median could be anywhere between (but NOT including ! ) 2 and 3.
The same goes for the quartiles. Q1 is defined such that 1/4 of the values lie below it, and 3/4 lie above. Likewise, but reverse for Q3.
The boxplot function may have taken the extremes, added them and divided the result by 4 (for Q1) 2 (for the median) and 3/4 (for Q3).
That would give the results as displayed. Unfortunately I can't check.... Express limitation.
Luc
Mar 08, 2017
08:15 AM
- Mark as New
- Bookmark
- Subscribe
- Mute
- Subscribe to RSS Feed
- Permalink
- Notify Moderator
Please log in to access translation
Mar 08, 2017
08:15 AM
Ah, probably a better guess is that Prime uses the minitab method from:
Quartile -- from Wolfram MathWorld
Luc
Mar 08, 2017
11:42 AM
- Mark as New
- Bookmark
- Subscribe
- Mute
- Subscribe to RSS Feed
- Permalink
- Notify Moderator
Please log in to access translation
Mar 08, 2017
11:42 AM
thanks for your effort! 


