Community Tip - Stay updated on what is happening on the PTC Community by subscribing to PTC Community Announcements. X
- Subscribe to RSS Feed
- Mark Topic as New
- Mark Topic as Read
- Float this Topic for Current User
- Bookmark
- Subscribe
- Mute
- Printer Friendly Page
Mathcad Prime 5 graphs!
- Mark as New
- Bookmark
- Subscribe
- Mute
- Subscribe to RSS Feed
- Permalink
- Notify Moderator
Mathcad Prime 5 graphs!
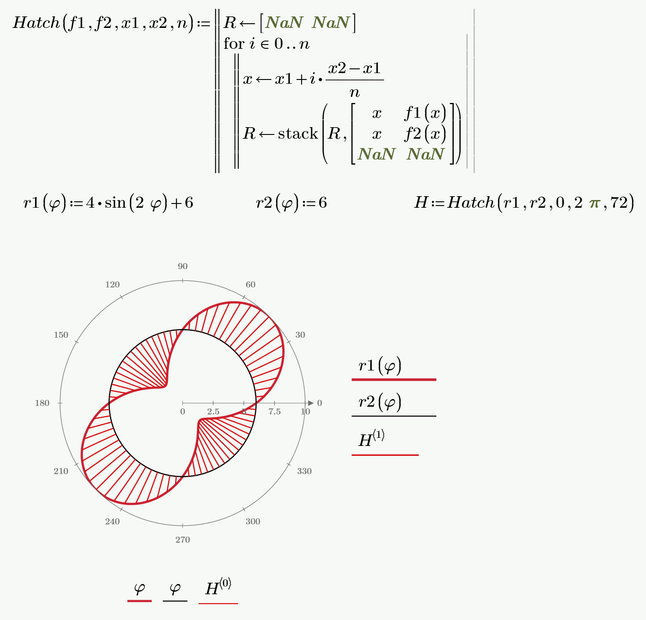
Mathcad Prime 5 displays some really nice 2D plots but is it possible to do something like this? Sort of a hatch for the graph.
Solved! Go to Solution.
- Labels:
-
Other
- Mark as New
- Bookmark
- Subscribe
- Mute
- Subscribe to RSS Feed
- Permalink
- Notify Moderator
Here is a quick hack which should help.
I am using basically the very same hatch function I posted here near three years ago. This time, for a change, I have chosen the last function argument to be the number of hatch lines (minus 1) rather than the "distance" between two lines.
- Mark as New
- Bookmark
- Subscribe
- Mute
- Subscribe to RSS Feed
- Permalink
- Notify Moderator
The modification you suggested worked perfect! Thanks for the assistance. The blue line data represents calculated moment acting on the circular body. Using Mathcad Prime 3.0 for reference, so I don't have a good way of showing gridlines on this figure.
- Mark as New
- Bookmark
- Subscribe
- Mute
- Subscribe to RSS Feed
- Permalink
- Notify Moderator
- Tags:
- Prime_7.0
- Mark as New
- Bookmark
- Subscribe
- Mute
- Subscribe to RSS Feed
- Permalink
- Notify Moderator
- Tags:
- Prime_7.0
- « Previous
-
- 1
- 2
- Next »


