
Turn on suggestions
Auto-suggest helps you quickly narrow down your search results by suggesting possible matches as you type.
Showing results for
Please log in to access translation
Turn on suggestions
Auto-suggest helps you quickly narrow down your search results by suggesting possible matches as you type.
Showing results for
Community Tip - Did you know you can set a signature that will be added to all your posts? Set it here! X
Translate the entire conversation x
Please log in to access translation
Options
- Subscribe to RSS Feed
- Mark Topic as New
- Mark Topic as Read
- Float this Topic for Current User
- Bookmark
- Subscribe
- Mute
- Printer Friendly Page
Mathcad predict function
Nov 22, 2015
03:23 AM
- Mark as New
- Bookmark
- Subscribe
- Mute
- Subscribe to RSS Feed
- Permalink
- Notify Moderator
Please log in to access translation
Nov 22, 2015
03:23 AM
Mathcad predict function
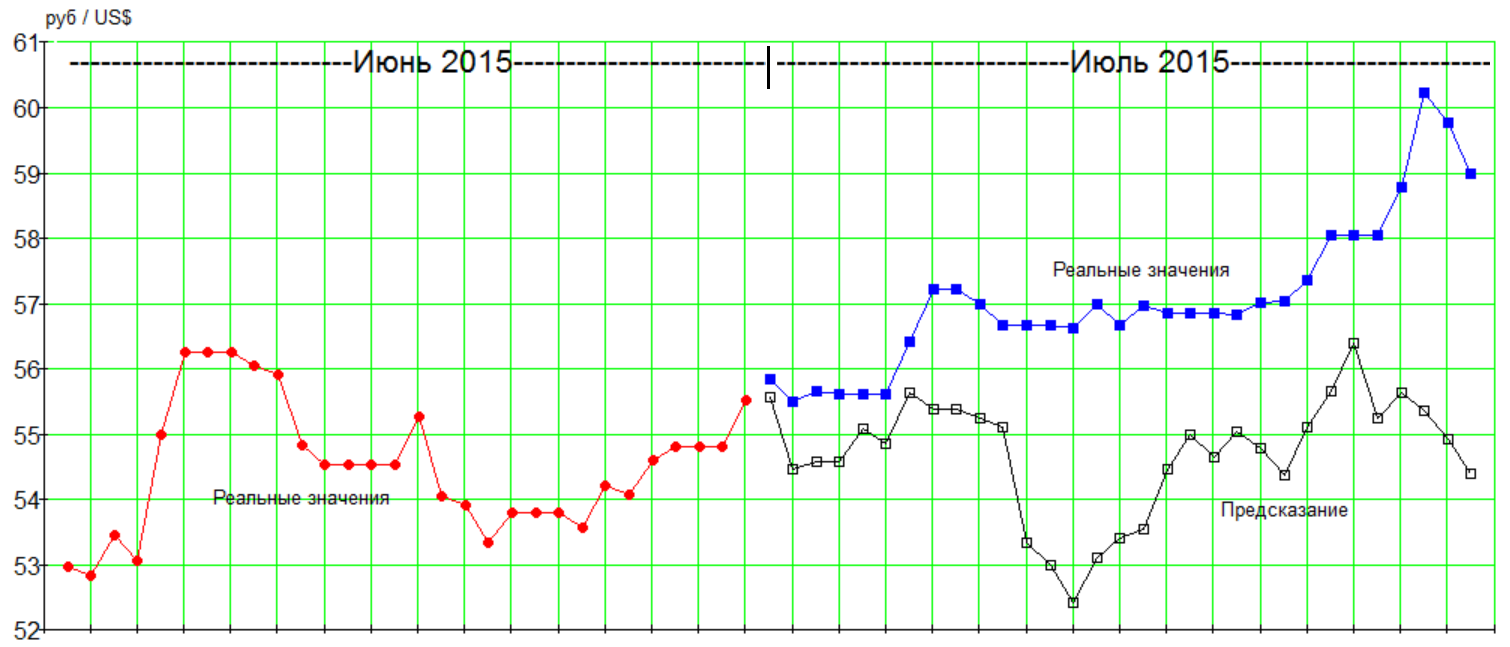
Mathcad predict function and Rub/$ ratio 
Labels:
- Labels:
-
Other
10 REPLIES 10
Jan 17, 2020
08:36 AM
- Mark as New
- Bookmark
- Subscribe
- Mute
- Subscribe to RSS Feed
- Permalink
- Notify Moderator
Please log in to access translation
Jan 17, 2020
08:36 AM
Don't invest on stocks using this? 🤣
Jan 17, 2020
11:54 AM
- Mark as New
- Bookmark
- Subscribe
- Mute
- Subscribe to RSS Feed
- Permalink
- Notify Moderator
Please log in to access translation
Jan 17, 2020
11:54 AM
Hi
it's a life that I use this function .... indeed since it is not useful ... I don't use it anymore ....

Jan 17, 2020
02:12 PM
- Mark as New
- Bookmark
- Subscribe
- Mute
- Subscribe to RSS Feed
- Permalink
- Notify Moderator
Please log in to access translation

Jan 17, 2020
03:22 PM
- Mark as New
- Bookmark
- Subscribe
- Mute
- Subscribe to RSS Feed
- Permalink
- Notify Moderator
Please log in to access translation
Jan 17, 2020
03:22 PM
Hello,
Well I am new with this function, but I saw a lot of bad comments about it in the community. However in the PTC Help Center includes a great example of this function.
I have a very similar curve from a stock market. I am using this function and it seems that sometimes works, sometimes not. I am guessing that is because the quantity of the sample used to predict. In your posts, you use like a half of the range (k=0..99 so n=50), and yu have very good results. I am trying.
If this fails, I am thinking also in Taylor or Pade aproximations. Do you have any suggestion on this? Am I believing in Santa Claus?
Thanks for the comment!

Jan 17, 2020
03:49 PM
- Mark as New
- Bookmark
- Subscribe
- Mute
- Subscribe to RSS Feed
- Permalink
- Notify Moderator
Please log in to access translation
Jan 17, 2020
03:49 PM
A cyan woman comes up to me on the street and says: "Let me tell you a fortune and predict your future!" I answer her: "Go to the stock exchange and predict there!"
Jan 17, 2020
04:21 PM
- Mark as New
- Bookmark
- Subscribe
- Mute
- Subscribe to RSS Feed
- Permalink
- Notify Moderator
Please log in to access translation
Jan 17, 2020
04:21 PM
Hi,
things are very different when dealing with random variables. I used it to predict the extraction of six numbers placed in increasing sequence (i.e. for each extraction the numbers are arranged with the smallest on the left and the largest on the right) and on the basis of a fairly large sample, knowing, of each of them, the statistical distribution (using the histogram function) based on the position of the same with respect to the others. But the predict function, at most, found two, each belonging to one of the first three columns.
Jan 17, 2020
06:41 PM
- Mark as New
- Bookmark
- Subscribe
- Mute
- Subscribe to RSS Feed
- Permalink
- Notify Moderator
Please log in to access translation
Jan 17, 2020
06:41 PM
I found some interesting results. Maybe predict is not the best method, but in comparison to the other techniques of prediction of the Market, this thing is gold. World is crazy. I still will try with other options and if someone had some ideas, suggestions and critics, all are welcomed!

In the example, O is a matrix that indicates the closing price of the market in 1-minute interval.
Matrix size: +15500 values.
Jan 17, 2020
09:45 PM
- Mark as New
- Bookmark
- Subscribe
- Mute
- Subscribe to RSS Feed
- Permalink
- Notify Moderator
Please log in to access translation
Jan 17, 2020
09:45 PM
This thing is ! (now I can say it with a background) 😅

Jan 18, 2020
01:10 PM
- Mark as New
- Bookmark
- Subscribe
- Mute
- Subscribe to RSS Feed
- Permalink
- Notify Moderator
Please log in to access translation
Jan 18, 2020
01:10 PM

Jan 18, 2020
04:03 PM
- Mark as New
- Bookmark
- Subscribe
- Mute
- Subscribe to RSS Feed
- Permalink
- Notify Moderator
Please log in to access translation
Jan 18, 2020
04:03 PM
That's less than 40%. Is there another way to extrapolate functions here?


