Community Tip - Learn all about the Community Ranking System, a fun gamification element of the PTC Community. X
- Subscribe to RSS Feed
- Mark Topic as New
- Mark Topic as Read
- Float this Topic for Current User
- Bookmark
- Subscribe
- Mute
- Printer Friendly Page
Need a smoother curve .......
- Mark as New
- Bookmark
- Subscribe
- Mute
- Subscribe to RSS Feed
- Permalink
- Notify Moderator
Need a smoother curve .......
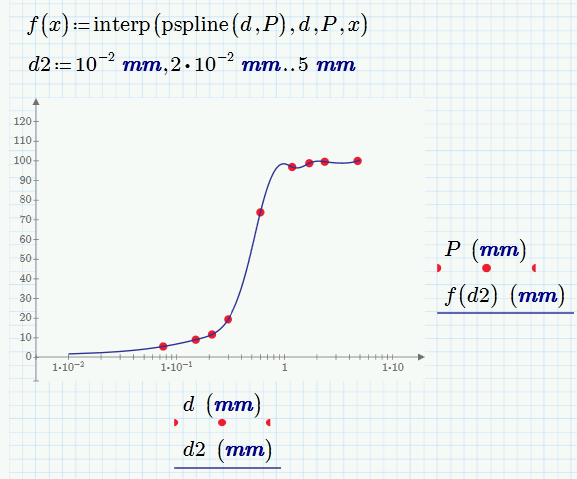
I'm attaching a prime 3.1 file . In which i tried to interpolate two sets of data to make a smooth curve like Excel plotting . But the curve is not so smooth , like what I'm expecting .
- Labels:
-
Statistics_Analysis
- Mark as New
- Bookmark
- Subscribe
- Mute
- Subscribe to RSS Feed
- Permalink
- Notify Moderator
See please the attach.
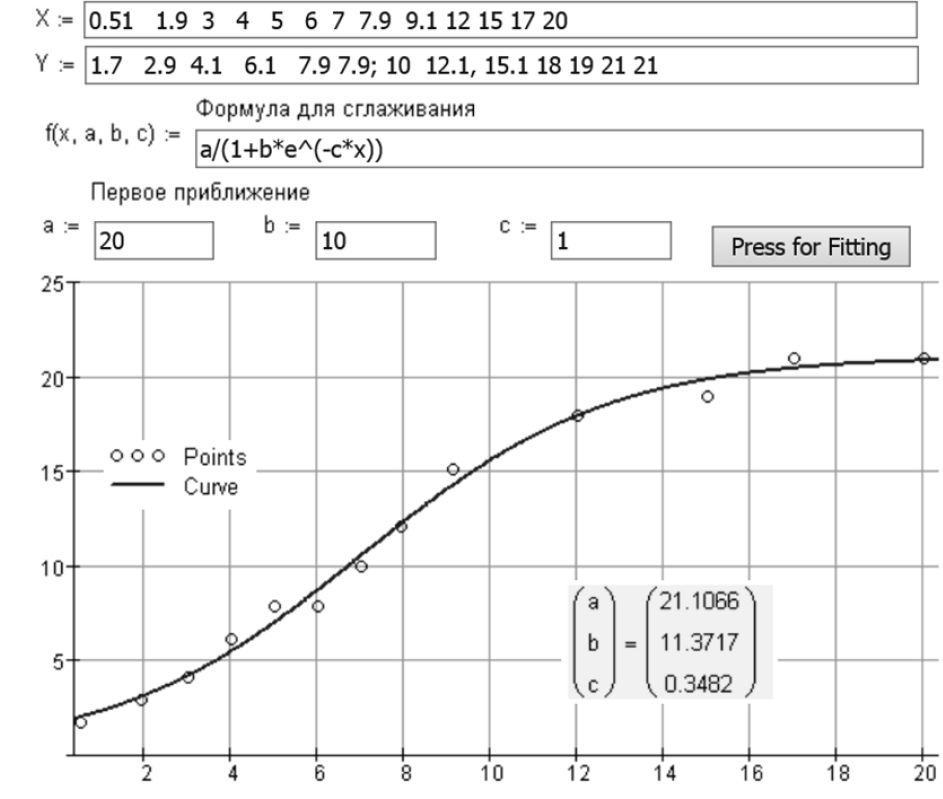
But you need not a spine interpolation but a fittings.

- Mark as New
- Bookmark
- Subscribe
- Mute
- Subscribe to RSS Feed
- Permalink
- Notify Moderator
Unfortunately I can't read P3.1 files (just 3.0).
So here is a file using spline interpolation and a few regressions.
Valey is showing a logistic model but with different data compared with the Excel sheet ?
- Mark as New
- Bookmark
- Subscribe
- Mute
- Subscribe to RSS Feed
- Permalink
- Notify Moderator
- Mark as New
- Bookmark
- Subscribe
- Mute
- Subscribe to RSS Feed
- Permalink
- Notify Moderator
Thanks.
So I see what the problem is:

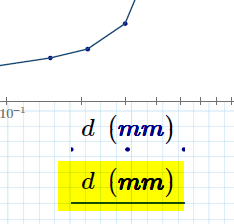
This second abscissa value has to be either an undefined variable (if you dispense with the units) or a range variable. I had shown how to do it in my first reply - here is the version using units

- Mark as New
- Bookmark
- Subscribe
- Mute
- Subscribe to RSS Feed
- Permalink
- Notify Moderator
When you create the plot you just need to increase the step for the variable argument of function.


