Community Tip - Your Friends List is a way to easily have access to the community members that you interact with the most! X
- Subscribe to RSS Feed
- Mark Topic as New
- Mark Topic as Read
- Float this Topic for Current User
- Bookmark
- Subscribe
- Mute
- Printer Friendly Page
Nonlinear least squares with minerr
- Mark as New
- Bookmark
- Subscribe
- Mute
- Subscribe to RSS Feed
- Permalink
- Notify Moderator
Nonlinear least squares with minerr
Why is n taken as length(y)-1 rather than simply the length of y? In both Mathcad 15 and Prime 6, sometimes this seems to result in throwing away one observation. E.g., in the Prime 6 example, there are 12 observations, but only 11 show up on the plot.
Solved! Go to Solution.
- Labels:
-
Statistics_Analysis
Accepted Solutions
- Mark as New
- Bookmark
- Subscribe
- Mute
- Subscribe to RSS Feed
- Permalink
- Notify Moderator
Additional remark
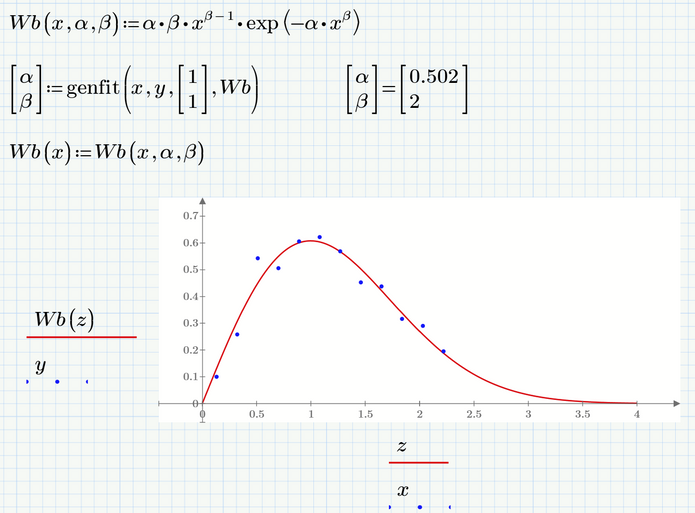
You probably know that you could also use "genfit" to calculate the necessary parameters:
- Mark as New
- Bookmark
- Subscribe
- Mute
- Subscribe to RSS Feed
- Permalink
- Notify Moderator
First it is always better to attach your worksheet. Mathcad starts counting at 0 but you can change this by changing the value for ORIGIN. That is the reason why for length(y)-1. Most likely for the same reason you only see 11 of the 12 points as you most likely started with 1 instead of 0. Hope this helps.
- Mark as New
- Bookmark
- Subscribe
- Mute
- Subscribe to RSS Feed
- Permalink
- Notify Moderator
?
?ORIGIN = 0, but the Prime 6 instruction sheet 'Example: Using minerr for Nonlinear Least Squares Fitting' explicitly states that n = length(y) - 1, and that i = 1..n. I think the problem is with this sheet.
My worksheet, however, gives the correct answer and plots all 12 observations for the Weibull example. See attachment.
Thanks.
- Mark as New
- Bookmark
- Subscribe
- Mute
- Subscribe to RSS Feed
- Permalink
- Notify Moderator
You did not attach a sheet, but you are absolutely right. The example in the Prime help simply is wrong. It should read i:=0..n, if we assume that the default value for ORIGIN (0) is used.
That error is already present in the help for Mathcad 15, too, The example was (like most of the Prime help) copied from there without further check.
A far better approach would be
as this is independent from the chosen value for ORIGIN.
On the other hand there is no reason for the range i anyway. Its just used for plotting and we can as well plot one vector over the other:
An additional error is when the example sheet calculated the MSE. They devide by n-2 but it should rather be a division by n+1 (or better by length(y) or by rows(y)).
- Mark as New
- Bookmark
- Subscribe
- Mute
- Subscribe to RSS Feed
- Permalink
- Notify Moderator
Additional remark
You probably know that you could also use "genfit" to calculate the necessary parameters:
- Mark as New
- Bookmark
- Subscribe
- Mute
- Subscribe to RSS Feed
- Permalink
- Notify Moderator
- Mark as New
- Bookmark
- Subscribe
- Mute
- Subscribe to RSS Feed
- Permalink
- Notify Moderator
@tburch wrote:
?Thanks. I haven't tried that yet. Do you think it's a better algorithm?
I don't think so. But using a solve block with minerr can offer additional possibilities to introduce further conditions and weighting them.
- Mark as New
- Bookmark
- Subscribe
- Mute
- Subscribe to RSS Feed
- Permalink
- Notify Moderator
- Mark as New
- Bookmark
- Subscribe
- Mute
- Subscribe to RSS Feed
- Permalink
- Notify Moderator
Thanks again for your replies. The one with your worksheet was particularly helpful.
Regarding my worksheet attachment, I don't know why you didn't receive it. But I'm not very familiar with the procedures here. Maybe next time.
I note that n is used for plotting but also in calculating mean-squared error. No documentation I can find sheds much light on this. Degrees of freedom presumably equals n - p, where p = the number of parameters to be estimated -- not 100% sure of this.


