Community Tip - When posting, your subject should be specific and summarize your question. Here are some additional tips on asking a great question. X
- Subscribe to RSS Feed
- Mark Topic as New
- Mark Topic as Read
- Float this Topic for Current User
- Bookmark
- Subscribe
- Mute
- Printer Friendly Page
Problem with a chaotic graph
- Mark as New
- Bookmark
- Subscribe
- Mute
- Subscribe to RSS Feed
- Permalink
- Notify Moderator
Problem with a chaotic graph
Hello,
I have a chaotic graph with the x-axis ranging from 0 to 200 increments. I would like to increase the increments of the x-axis to 20000 without that affecting the graph shape.
- Mark as New
- Bookmark
- Subscribe
- Mute
- Subscribe to RSS Feed
- Permalink
- Notify Moderator
Not quite sure what you are looking for.
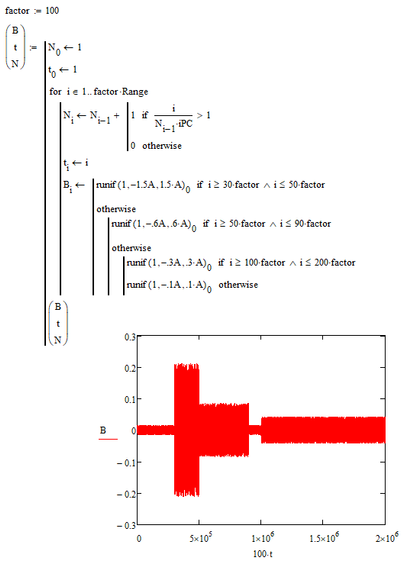
Do you mean a result like the following?
- Mark as New
- Bookmark
- Subscribe
- Mute
- Subscribe to RSS Feed
- Permalink
- Notify Moderator
or are you looking for something like this:
- Mark as New
- Bookmark
- Subscribe
- Mute
- Subscribe to RSS Feed
- Permalink
- Notify Moderator
Hi Warner_E
Thank you for your reply. I kind of want such a kind of graph but not in this way.
I want it to have 20000 increments. The thing you have done has 200 increments and you have multiplied it by 100.
I want a graph which look like this provided that both axes have 20000 increments. If I simply increase the range to 20000, the graph would be too messy.
I think the problem is somehow related to the random number generation of the file.
Best,
- Mark as New
- Bookmark
- Subscribe
- Mute
- Subscribe to RSS Feed
- Permalink
- Notify Moderator
@mzarrabi wrote:
Hi Warner_E
Thank you for your reply. I kind of want such a kind of graph but not in this way.
I want it to have 20000 increments. The thing you have done has 200 increments and you have multiplied it by 100.
I want a graph which look like this provided that both axes have 20000 increments. If I simply increase the range to 20000, the graph would be too messy.
I think the problem is somehow related to the random number generation of the file.
Best,
Yes, my first suggestion simply stretches the plot in abscissa direction but there still are just 200 data points.
But the second suggestion consists of 20000 data points and as you wrote that you'd like it to be similar to your first plot, I changed the intervals for the various different ranges for the random numbers accordingly.
Of course because of the much larger number of random points there is much more "up and down".
- Mark as New
- Bookmark
- Subscribe
- Mute
- Subscribe to RSS Feed
- Permalink
- Notify Moderator
Consider it as a cyclic loading. The first graph only has a few spikes of more than 0.1, but the second graph you are suggesting is having a lot of peaks exceeding 0.1. I don't want to change the loading features. I just need to break the graph into several points (like 20000) so that when I apply it to a numerical model the model could converge.
Maybe I need another function that divides peak to peak points of the first graph into 100 increments so that the graph can have 20000 points (200*100=20000).
- Mark as New
- Bookmark
- Subscribe
- Mute
- Subscribe to RSS Feed
- Permalink
- Notify Moderator
@mzarrabi wrote:
Consider it as a cyclic loading. The first graph only has a few spikes of more than 0.1, but the second graph you are suggesting is having a lot of peaks exceeding 0.1. I don't want to change the loading features. I just need to break the graph into several points (like 20000) so that when I apply it to a numerical model the model could converge.
Maybe I need another function that divides peak to peak points of the first graph into 100 increments so that the graph can have 20000 points (200*100=20000).
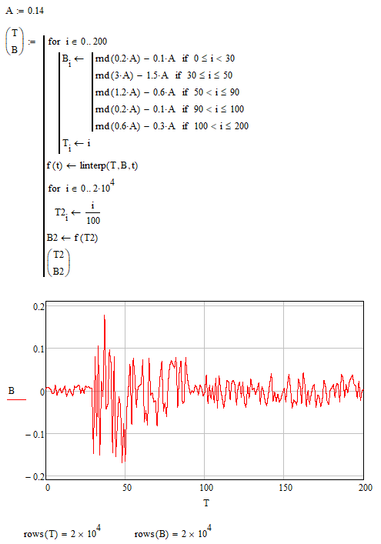
Maybe linear interpolation ("linterp") will do the job you are looking for? The plots will look exactly identical and only every hundredth point will be calculated at random - inbetween simple linear interpolation occurs.
- Mark as New
- Bookmark
- Subscribe
- Mute
- Subscribe to RSS Feed
- Permalink
- Notify Moderator
Here is an example of what I was talking about. I omitted the calculation of N as its not used for the plot.
You may also use spline interpolation instead of linear interpolation by writing
f(t)<--interp(cspline(T,B),T,B,t)
but I don't think that this will make much difference.
Worksheet (MC15) attached
- Mark as New
- Bookmark
- Subscribe
- Mute
- Subscribe to RSS Feed
- Permalink
- Notify Moderator


