Community Tip - You can subscribe to a forum, label or individual post and receive email notifications when someone posts a new topic or reply. Learn more! X
- Subscribe to RSS Feed
- Mark Topic as New
- Mark Topic as Read
- Float this Topic for Current User
- Bookmark
- Subscribe
- Mute
- Printer Friendly Page
Regression on data
- Mark as New
- Bookmark
- Subscribe
- Mute
- Subscribe to RSS Feed
- Permalink
- Notify Moderator
Regression on data
I am having a set of data that I have plottet in to a X-Y plot. But I would like to know the equation of these data, so that I can calculate the point where they are crossing each other. I have tried searching around both in this forum and other sites, but I have not been able to find a solution.
I have attached both a jpg file and a mathcad file.
- Labels:
-
Statistics_Analysis
- Mark as New
- Bookmark
- Subscribe
- Mute
- Subscribe to RSS Feed
- Permalink
- Notify Moderator
You have a lot of regression curves to choose from. Once you have the equation, solving for the intersection is easy.
- Mark as New
- Bookmark
- Subscribe
- Mute
- Subscribe to RSS Feed
- Permalink
- Notify Moderator
Could you be more specific on how I have to do it. I am totally lost. Those guides I find online seem very complicated compared to my level. I thougt I could just choose polyfit(x,y) and then it would give me the function.
- Mark as New
- Bookmark
- Subscribe
- Mute
- Subscribe to RSS Feed
- Permalink
- Notify Moderator
Polyfit makes it a little simpler, but it doesn't change much.
- Mark as New
- Bookmark
- Subscribe
- Mute
- Subscribe to RSS Feed
- Permalink
- Notify Moderator
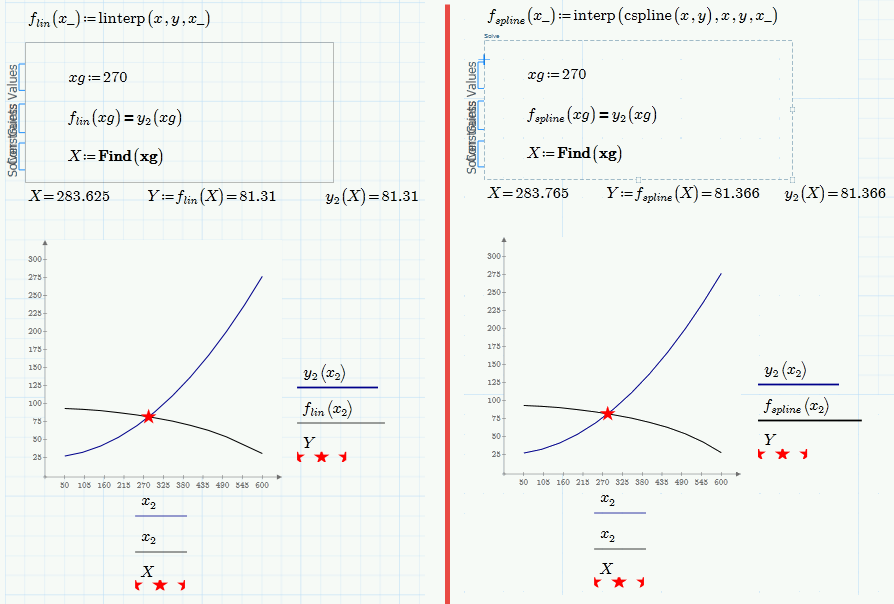
Using linear or spline interpolation you won't see an explicit equation but you can use the result like any other function:
WE
BTW, in case you wonder why we all don't use the sheet you posted but instead used the sheet where Fred retyped the part of the data which was visible from the picture you posted.
Fred, Richard and me - neither of us has Prime 3.1 installed (just 3.0) and so we are unable to open files in P3.1 format. As you can't save in P3.0 format, screenshots or pdf-prints are the only way to communicate your problem/worksheet.
Of course your Prime 3.1 can read our P3.0 files.
- Mark as New
- Bookmark
- Subscribe
- Mute
- Subscribe to RSS Feed
- Permalink
- Notify Moderator
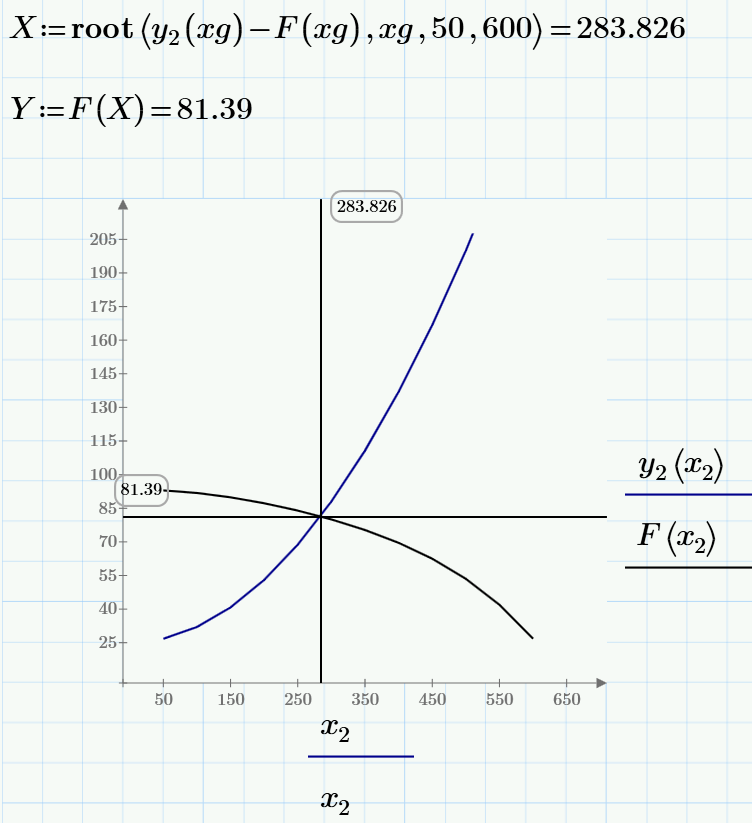
If we have one equation better use not the Find but the root function
- Mark as New
- Bookmark
- Subscribe
- Mute
- Subscribe to RSS Feed
- Permalink
- Notify Moderator
Root sure is an alternative, but I don't see why it should be "better".
Unless you are using Prime Express and can't use a solve block, of course.
- Mark as New
- Bookmark
- Subscribe
- Mute
- Subscribe to RSS Feed
- Permalink
- Notify Moderator
Werner Exinger написал(а):
Root sure is an alternative, but I don't see why it should be "better".
Unless you are using Prime Express and can't use a solve block, of course.
Better???
But more simple!
And second.
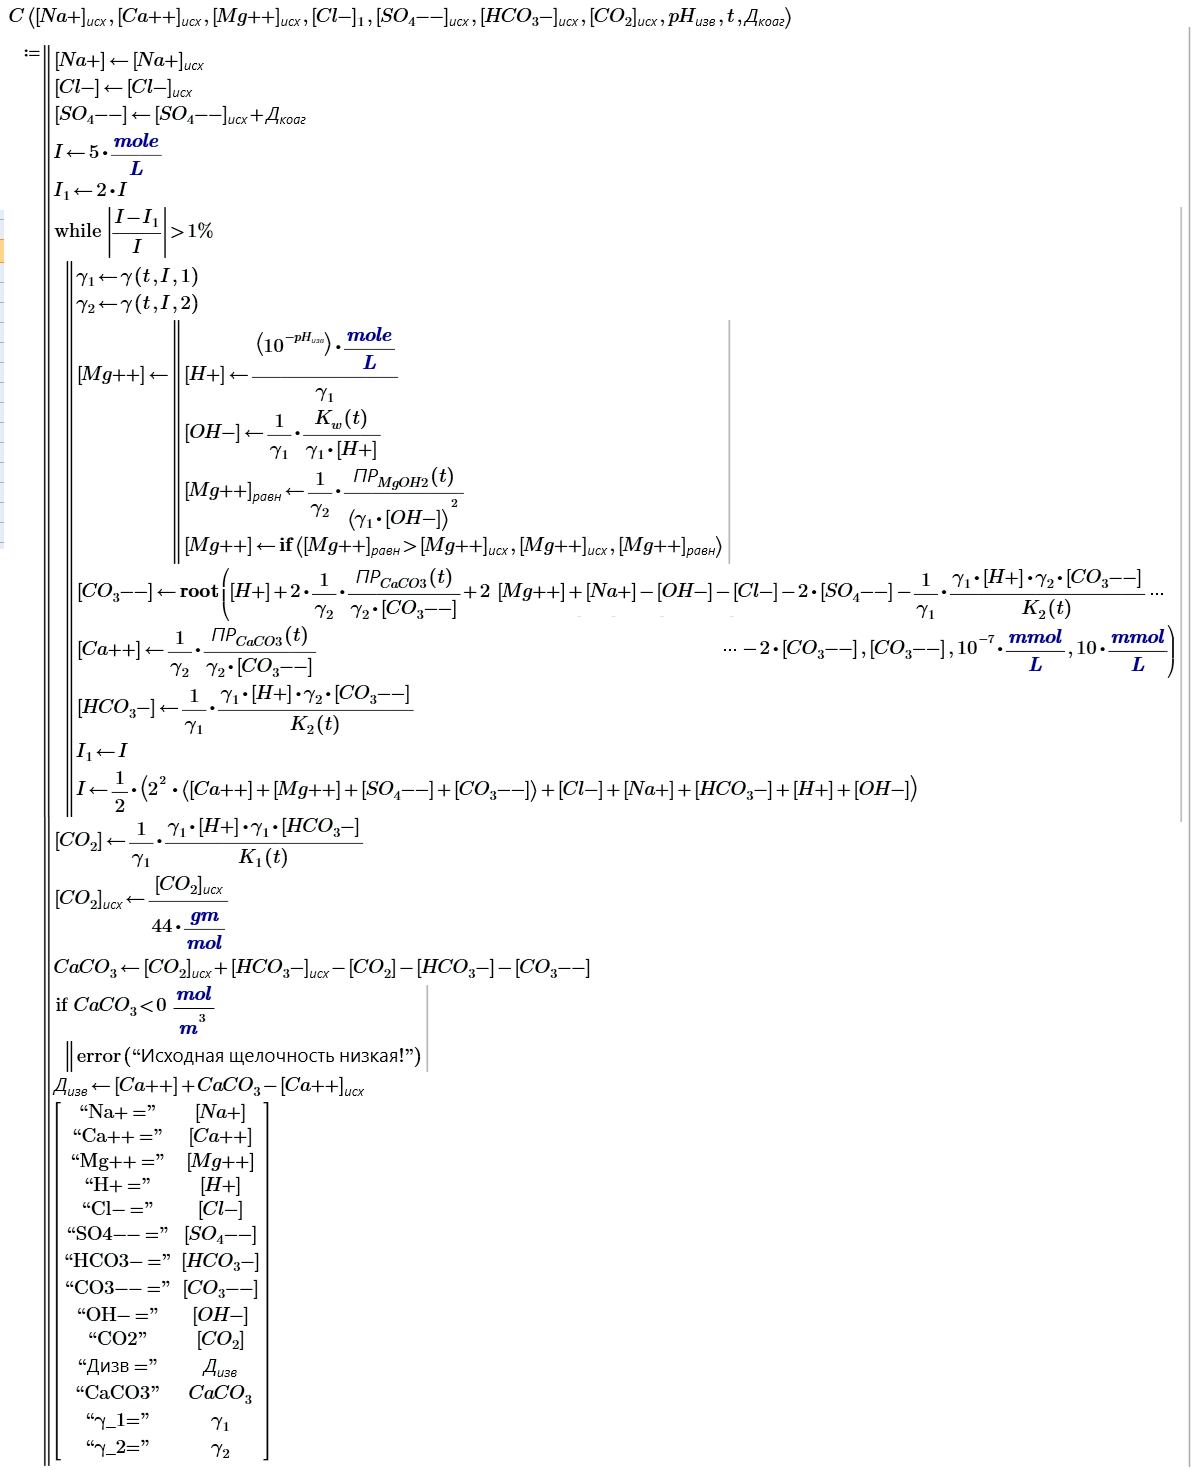
The root we can use in programs.
One example:
- Mark as New
- Bookmark
- Subscribe
- Mute
- Subscribe to RSS Feed
- Permalink
- Notify Moderator
FredKohlhepp I didn't see your attached file at first. I am sorry about that.
In the line with vs:=regress(x,y,5) what is does the 5 mean?
In the line with Fn(x,,vs): I have no clue what is happening after the equation sign. Is it somehting you have typed, or is this given by Mathcad in someway?
I appreciate the help you guys are giving me, even though I am a asking a lot of questions.
- Mark as New
- Bookmark
- Subscribe
- Mute
- Subscribe to RSS Feed
- Permalink
- Notify Moderator
In the line with vs:=regress(x,y,5) what is does the 5 mean?
The order of the polynomial that regress fits to the data.
In the line with Fn(x,,vs): I have no clue what is happening after the equation sign. Is it somehting you have typed, or is this given by Mathcad in someway?
The regress function returns the coefficients of a polynomial in the vector vs. The coefficients start at the fourth element of the vector (the first three elements are other information; you can ignore them). The summation represents that polynomial: vs0*x^0 + vs1*x^1 + vs2*x^2 + ...
- Mark as New
- Bookmark
- Subscribe
- Mute
- Subscribe to RSS Feed
- Permalink
- Notify Moderator
Thanks a lot.
It seems a lot more difficult tthan wordmath.
- Mark as New
- Bookmark
- Subscribe
- Mute
- Subscribe to RSS Feed
- Permalink
- Notify Moderator
Tommi Lauridsen wrote:
Thanks a lot.
It seems a lot more difficult tthan wordmath.
Whats wordmath?
- Mark as New
- Bookmark
- Subscribe
- Mute
- Subscribe to RSS Feed
- Permalink
- Notify Moderator
WordMath is an add-on for Word. It is actually working very well for a lot of things.
- Mark as New
- Bookmark
- Subscribe
- Mute
- Subscribe to RSS Feed
- Permalink
- Notify Moderator
You mean WordMat?
"WordMat is an addon to Microsoft Word. When installed a new ribbonmenu will be available in Word granting access to advanced mathematical functions. WordMat is free, released under GNU General Public Licence.".

- Mark as New
- Bookmark
- Subscribe
- Mute
- Subscribe to RSS Feed
- Permalink
- Notify Moderator
I had never even heard of wordmat ![]() . It looks interesting, and I'm going to install it. I'm sure it's nowhere near as powerful as Mathcad, but it might be useful for some things. If you have solved this problem using wordmat please post the document. I would like to see it.
. It looks interesting, and I'm going to install it. I'm sure it's nowhere near as powerful as Mathcad, but it might be useful for some things. If you have solved this problem using wordmat please post the document. I would like to see it.
- Mark as New
- Bookmark
- Subscribe
- Mute
- Subscribe to RSS Feed
- Permalink
- Notify Moderator
Same here 🙂
Unknown to me, will give it a try and would be interested in the document, too.
I was only aware of Microsofts Mathematics Add-in
https://www.microsoft.com/en-us/download/details.aspx?id=17786
which sure is interesting,too, to a certain degree, but wordmat looks a lot more interesting. I am already curious about the WolframA button I see in the screenshot Valdimir provided.
- Mark as New
- Bookmark
- Subscribe
- Mute
- Subscribe to RSS Feed
- Permalink
- Notify Moderator
WordMat support MS Office 2007, 2010, 2013 and 2016 versions.
Some quotes from FAQ ( EDUAP - WordMat - FAQ 😞
"WordMat is inspired by Microsoft Mathematics. WordMat is in many ways more powerful and feature rich.
WordMat was designed for the danish equivalent to 'high school' which allows extensive use of math programs, even at exams. It is however very versatile and is also used by primary schools and higher education schools and universities."
- Mark as New
- Bookmark
- Subscribe
- Mute
- Subscribe to RSS Feed
- Permalink
- Notify Moderator
I was only aware of Microsofts Mathematics Add-in
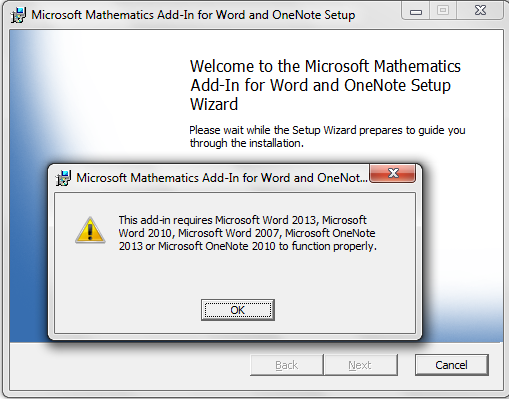
It won't even install with the latest version of Office. I have installed Wordmat, but haven't had time to try anything with it yet.
- Mark as New
- Bookmark
- Subscribe
- Mute
- Subscribe to RSS Feed
- Permalink
- Notify Moderator
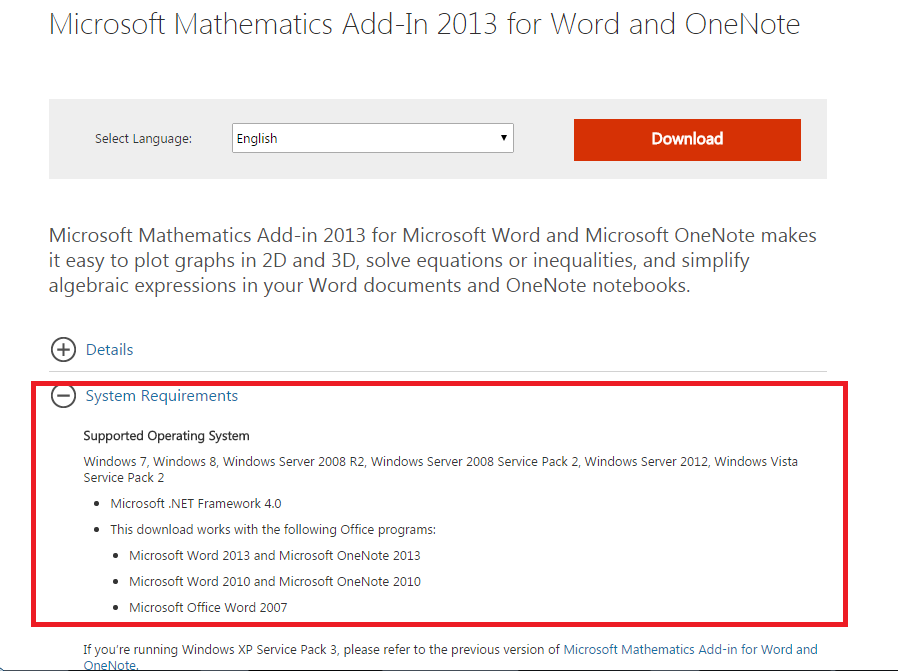
In "System Requirements" there is no mention about the latest 2016 MS Office version.

- Mark as New
- Bookmark
- Subscribe
- Mute
- Subscribe to RSS Feed
- Permalink
- Notify Moderator
It complained when I tried to install it. The installer listed the versions of office it's compatible with (which does not include Office 2016), and then quit.
- Mark as New
- Bookmark
- Subscribe
- Mute
- Subscribe to RSS Feed
- Permalink
- Notify Moderator
Interesting!
From an FAQ page on the web site:
Which versions of Office are supported?
You can use Office 2007, 2010, 2013 and 2016 but not earlier versions. WordMat does not work with Word online or iPad versions. Office 2010, 2013 and 2016 comes in 4 different flavors: Starter, 32-bit, 64-bit and a Click'n run-version, which can be downloaded.
The starter version will not work with WordMat.
- Mark as New
- Bookmark
- Subscribe
- Mute
- Subscribe to RSS Feed
- Permalink
- Notify Moderator
- Mark as New
- Bookmark
- Subscribe
- Mute
- Subscribe to RSS Feed
- Permalink
- Notify Moderator
Fred, you are talking about "WordMat" but Richard is talking about the Microsoft Mathematics Add-In, which is rather old and wasn't further developed by M$.
WordMat maybe was inspired by the M$ add-in, but is completely different.
- Mark as New
- Bookmark
- Subscribe
- Mute
- Subscribe to RSS Feed
- Permalink
- Notify Moderator
Richard Jackson wrote:
... it might be useful for some things...
I would be interested to see such examples from you. I want to install this add-in in MS Office 2010 and 2016 version to consider the ability of this toolbox better.
- Mark as New
- Bookmark
- Subscribe
- Mute
- Subscribe to RSS Feed
- Permalink
- Notify Moderator
I can try doing it in the weekend ![]()
- Mark as New
- Bookmark
- Subscribe
- Mute
- Subscribe to RSS Feed
- Permalink
- Notify Moderator
This is an example of how it could be done in WordMat . It is done very quick, and there is some autogenerated danish word in the document. Hope it makes sense to you.
I have found another another problem in MathCad. I can't multiply two matrices? It seems like instead of multiplying it is adding all of the numbers in the matrices each of them and multiplying them afterwards. I have no problems if I am dividing them?
I have attached a file showing imy problem. I get only one solution. Instead of a solution for each row?
- Mark as New
- Bookmark
- Subscribe
- Mute
- Subscribe to RSS Feed
- Permalink
- Notify Moderator
You are multiplying two vectors and what you get is the scalar product - so all ist OK.
You want a vector as result where the first component is the product of the first components of the two initial vectors. Thats not what matrix or vector product ist meant for from a mathematical point of view.
But Mathcad has a solution for this which is called vectorization. You have to vectorize the product (matrix palette, they symbol is the right arrow) to get what you want to see.
R
- Mark as New
- Bookmark
- Subscribe
- Mute
- Subscribe to RSS Feed
- Permalink
- Notify Moderator
Thanks. That solved my problem!
- Mark as New
- Bookmark
- Subscribe
- Mute
- Subscribe to RSS Feed
- Permalink
- Notify Moderator
Thats strange. Just wanted to edit the above answer of mine and even though still nobody had replied to it, I am not offered the option to edit!?
So here's the screenshot I wanted to include,
and no the numbers are not added and multiplied afterwards - thats not how the dot product works (see picture).

- Mark as New
- Bookmark
- Subscribe
- Mute
- Subscribe to RSS Feed
- Permalink
- Notify Moderator
Werner Exinger wrote:
Thats strange. Just wanted to edit the above answer of mine...
Are you sure? It was some "R" in signature but not "WE" ![]() .
.


