
Turn on suggestions
Auto-suggest helps you quickly narrow down your search results by suggesting possible matches as you type.
Showing results for
Please log in to access translation
Turn on suggestions
Auto-suggest helps you quickly narrow down your search results by suggesting possible matches as you type.
Showing results for
Community Tip - When posting, your subject should be specific and summarize your question. Here are some additional tips on asking a great question. X
Translate the entire conversation x
Please log in to access translation
Options
- Subscribe to RSS Feed
- Mark Topic as New
- Mark Topic as Read
- Float this Topic for Current User
- Bookmark
- Subscribe
- Mute
- Printer Friendly Page
Using ANOVA in MathCAD
Oct 20, 2011
09:45 PM
- Mark as New
- Bookmark
- Subscribe
- Mute
- Subscribe to RSS Feed
- Permalink
- Notify Moderator
Please log in to access translation
Oct 20, 2011
09:45 PM
Using ANOVA in MathCAD
I am relatively new to the study of statistics. I did this problem in excel. I thought I would compare to MathCAD. What am I doing wrong?
Thanks for any help or direction on how to use/interpret MathCADs Anova function.
Matt
Labels:
- Labels:
-
Statistics_Analysis
3 REPLIES 3
Oct 21, 2011
06:53 AM
- Mark as New
- Bookmark
- Subscribe
- Mute
- Subscribe to RSS Feed
- Permalink
- Notify Moderator
Please log in to access translation
Oct 21, 2011
06:53 AM
Hello!
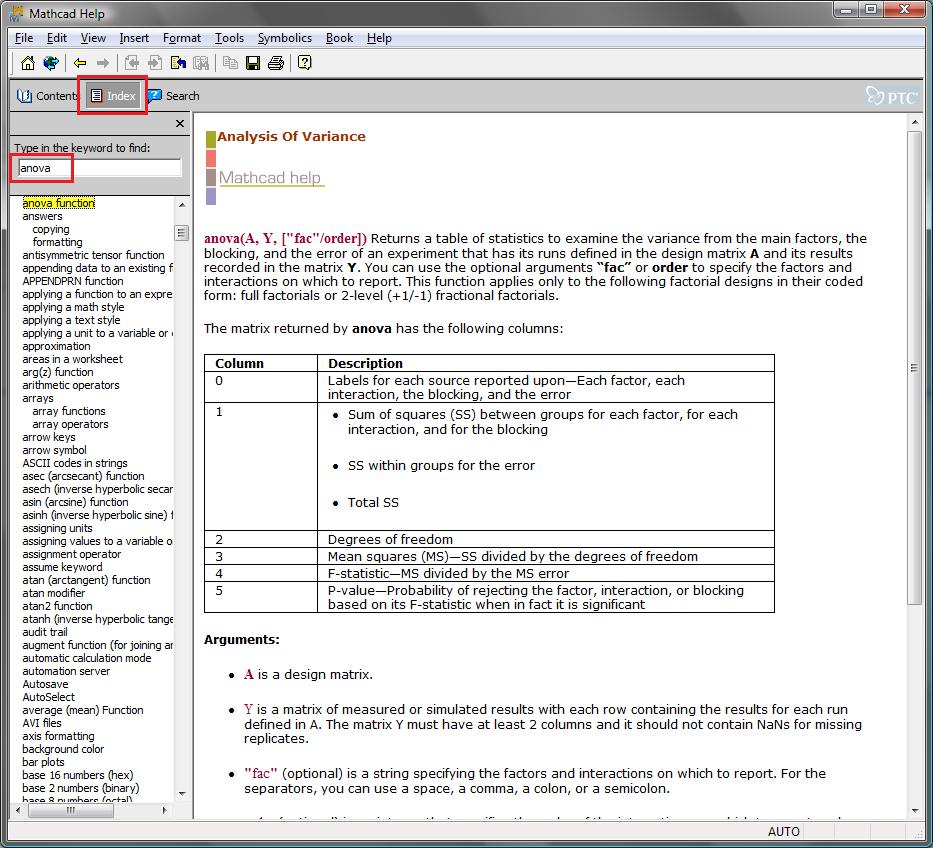
Look in the help file "Mathcad Help" (F1) for the keyword "anova". There you can find examples of the work function "anova".
Also you can install the e-book "Practical Statistics" (there also it is possible to find examples of the ANOVA analysis). You can download it here: http://communities.ptc.com/docs/DOC-1611
Oct 21, 2011
10:40 PM
- Mark as New
- Bookmark
- Subscribe
- Mute
- Subscribe to RSS Feed
- Permalink
- Notify Moderator
Please log in to access translation
Oct 21, 2011
10:40 PM
I was originally confused by the design matrix A and its dimensions. After rereading the MathCAD help you mentioned I noticed that 'A' to number of runs of data. It was initially confusing since MathCADs help used an example that had 5 sets of data with 5 replicates. A nights sleep and a new look as brought insight.
Thanks
Matt
Dec 01, 2011
10:39 PM
- Mark as New
- Bookmark
- Subscribe
- Mute
- Subscribe to RSS Feed
- Permalink
- Notify Moderator
Please log in to access translation
Dec 01, 2011
10:39 PM
You need to fix your setup for the analysis to work. First you need to recognize that your Y should be 15x1 not 5x3. Your X is a choice of A, B or C varieties but has to be parameterized. One way to do this is by using a value plus 2 indicator functions (= 0 or 1). It will help if you write out the model equation (everything in statistics needs a model equation). Y = beta0 + beta1*A + beta2*B + error where A = 1 if type A, 0 otherwise; B = 1 if type B, 0 otherwise; and type C has both A=0 and B = 0. This gives us 3 types using 2 parameters.
Your X then is a 15x3 where the first column is all 1's, 2nd column is the indicators for Atype, 3rd column is the indicators for Btype. The equation in matrix notation looks like Y = X * Beta and you solve for Beta. Note that Beta is 3x1


