
Turn on suggestions
Auto-suggest helps you quickly narrow down your search results by suggesting possible matches as you type.
Showing results for
Please log in to access translation
Turn on suggestions
Auto-suggest helps you quickly narrow down your search results by suggesting possible matches as you type.
Showing results for
Community Tip - Did you get an answer that solved your problem? Please mark it as an Accepted Solution so others with the same problem can find the answer easily. X
Translate the entire conversation x
Please log in to access translation
Options
- Subscribe to RSS Feed
- Mark Topic as New
- Mark Topic as Read
- Float this Topic for Current User
- Bookmark
- Subscribe
- Mute
- Printer Friendly Page
Vector Field
Jan 09, 2018
05:26 PM
- Mark as New
- Bookmark
- Subscribe
- Mute
- Subscribe to RSS Feed
- Permalink
- Notify Moderator
Please log in to access translation
Jan 09, 2018
05:26 PM
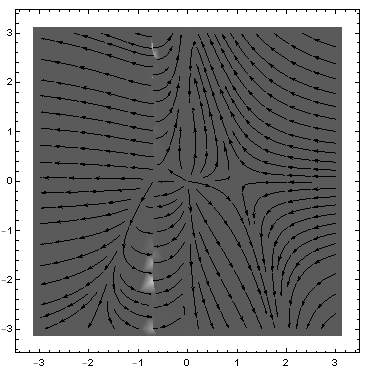
Vector Field

This is a vector field of dynamical system.
How can this directions be explained?
i seem not to understand this at all.
Labels:
- Labels:
-
Other
3 REPLIES 3
Jan 09, 2018
06:44 PM
- Mark as New
- Bookmark
- Subscribe
- Mute
- Subscribe to RSS Feed
- Permalink
- Notify Moderator
Please log in to access translation
Jan 09, 2018
06:44 PM
I am not sure what exactly you mean by "how it can be explained", what you expect as answer and how your question relates to Mathcad.
Jan 10, 2018
07:32 AM
- Mark as New
- Bookmark
- Subscribe
- Mute
- Subscribe to RSS Feed
- Permalink
- Notify Moderator
Please log in to access translation
Jan 10, 2018
07:32 AM
The only place I've ever used a vector field plot was for magnetic field strength.
Typically, the tail of the vector is at the (x,y) location of the evaluation, the length of the vector is proportional to the magnitude of the quantity, and the arrow is tangent to the direction of the field. (Magnetic field is a vector with components in the x and y directions.)
What your image is a plot of I cannot say, so interpretation is not something I want to attempt. It looks like you have two images--there's a clear edge slightly left of center.
Jan 10, 2018
11:01 AM
- Mark as New
- Bookmark
- Subscribe
- Mute
- Subscribe to RSS Feed
- Permalink
- Notify Moderator
Please log in to access translation
Jan 10, 2018
11:01 AM
Was this plot created with Mathcad at all? Doesn't seem likely, because a vector field plot in Mathcad only has streight arrows, many of the arrows in your plot are curved.
This - may - be a vector field plot, created from an ideal system model that incorrectly models a real system.
Notice how arrows are pointing in opposite directions from a line at x=-0.7 . As such that line is a source for y>0 and a pit for y<0; another source is at (0,0).
Success!
Luc


