Community Tip - Visit the PTCooler (the community lounge) to get to know your fellow community members and check out some of Dale's Friday Humor posts! X
- Subscribe to RSS Feed
- Mark Topic as New
- Mark Topic as Read
- Float this Topic for Current User
- Bookmark
- Subscribe
- Mute
- Printer Friendly Page
beginner question.... creating 3D plots from a 2D array
- Mark as New
- Bookmark
- Subscribe
- Mute
- Subscribe to RSS Feed
- Permalink
- Notify Moderator
beginner question.... creating 3D plots from a 2D array
I am sure there is a simple solution to my question.... give the attached file, I am trying to compute the radiant energy from a fire to a target (using the point source method) and wish to turn the 2D plot into a 3D plot as a function of distance and angle from the fire. Meaning, if the fire is at coordinates 0,0, I am trying to figure out the commands for placing the target from 1 m to a given distance (in this case 121m) from the fire in any direction along the x,y coordinates and then plot in 3D.... I am sure its easy, but this rookie can't figure it out... Any assistance is appreciated.
Solved! Go to Solution.
- Labels:
-
Mathcad Usage
Accepted Solutions
- Mark as New
- Bookmark
- Subscribe
- Mute
- Subscribe to RSS Feed
- Permalink
- Notify Moderator
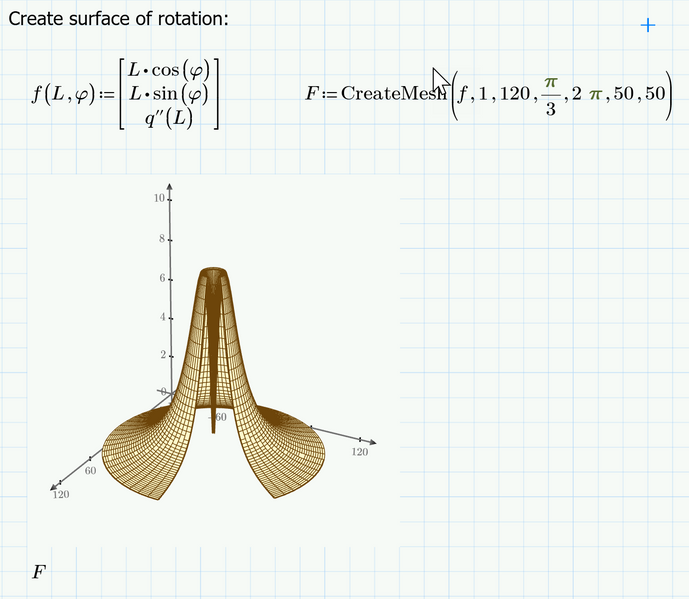
Here is how to create the surface of rotation, if it is this you are looking for.
For a fully closed surface you'd had to exchange the pi/3 for a 0.
Unfortunately Primes 3D plotting capabilities are quite mediocre, even compared to real Mathcad. No colormap, no transparency effects, no lighting, no control over perspective, no contour fill, bad autoscale, ... and a lot of other drawbacks. Its quite impossible to make the plot at least nearly good looking.
- Mark as New
- Bookmark
- Subscribe
- Mute
- Subscribe to RSS Feed
- Permalink
- Notify Moderator
Not sure what exactly you'd like to achieve.
Guess the angle you are talking about is NOT theta because theta depends on L.
Do you simply want to rotate the curve you plotted around the q'' axis?
- Mark as New
- Bookmark
- Subscribe
- Mute
- Subscribe to RSS Feed
- Permalink
- Notify Moderator
Here is how to create the surface of rotation, if it is this you are looking for.
For a fully closed surface you'd had to exchange the pi/3 for a 0.
Unfortunately Primes 3D plotting capabilities are quite mediocre, even compared to real Mathcad. No colormap, no transparency effects, no lighting, no control over perspective, no contour fill, bad autoscale, ... and a lot of other drawbacks. Its quite impossible to make the plot at least nearly good looking.
- Mark as New
- Bookmark
- Subscribe
- Mute
- Subscribe to RSS Feed
- Permalink
- Notify Moderator
Thanks for the response. Effectively, rotating resultant around the z axis. Let's assume for illustration the center a fire is at 0,0,10 (meaning the fire center is 10m high), and I want to develop a ground level heat map ranging from 1m to 121m along the x,y coordinates. If the first calculation is at 1,1,10 I would like to know the radiant heat flux at each increment of 10m outward from the fire.... to a final distance away of 121m (121, 121,10 - for x,y,z)
- Mark as New
- Bookmark
- Subscribe
- Mute
- Subscribe to RSS Feed
- Permalink
- Notify Moderator
@greenhorn wrote:
Thanks for the response. Effectively, rotating resultant around the z axis. L
I am not sure if this means that the surface of rotation I showed answered your question?
Let's assume for illustration the center a fire is at 0,0,10 (meaning the fire center is 10m high), and I want to develop a ground level heat map ranging from 1m to 121m along the x,y coordinates. If the first calculation is at 1,1,10 I would like to know the radiant heat flux at each increment of 10m outward from the fire.... to a final distance away of 121m (121, 121,10 - for x,y,z)
Is this a new question? About how you manage to get a table of values?
- Mark as New
- Bookmark
- Subscribe
- Mute
- Subscribe to RSS Feed
- Permalink
- Notify Moderator
It got me close enough.... I can use the information. Thanks for bailing me out
- Mark as New
- Bookmark
- Subscribe
- Mute
- Subscribe to RSS Feed
- Permalink
- Notify Moderator
OK, I wasn't sure. Glad you are up and running.
Here is a slightly different approach showing the same surface but with a rectangular base.
BTW, I am not sure why the contour-plot does not work with the structure F created by CreateMesh. It should, at least it does in real Mathcad, but maybe Prime is different in that way. I prefer using CreateMesh because it gives me a little bit more and easier control compared to using the original function and changing the limits in the plot directly.
Prime 5 sheet attached.
- Mark as New
- Bookmark
- Subscribe
- Mute
- Subscribe to RSS Feed
- Permalink
- Notify Moderator


