Community Tip - Learn all about the Community Ranking System, a fun gamification element of the PTC Community. X
- Subscribe to RSS Feed
- Mark Topic as New
- Mark Topic as Read
- Float this Topic for Current User
- Bookmark
- Subscribe
- Mute
- Printer Friendly Page
exit option for if condition
- Mark as New
- Bookmark
- Subscribe
- Mute
- Subscribe to RSS Feed
- Permalink
- Notify Moderator
exit option for if condition
Hi everybody,
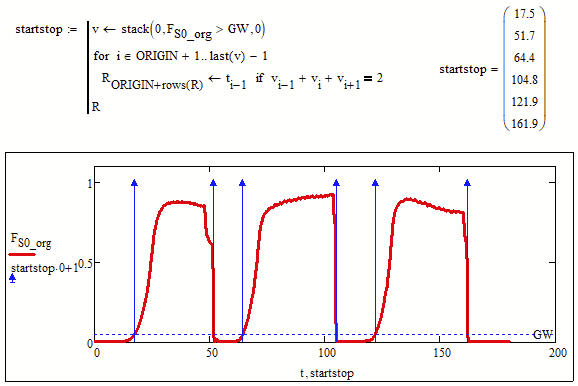
I ask you because I don’t know any solution. I have some Data in the given Ex-celsheet. Interesting is the force F_S0_org and the according time t. This is the red plot in the diagram. I want to read out the time when the force F_S0_org is higher than the parameter GW for the first and for the last time. (For all three curves, to seperate them later) But my program gives me back all the the times. The problem is, that I don’t know how to realize an exit option for my if condition after it found the first time….
Something like break or continue. But it doesn’t do anything when I use these commands.
You can see that in the diagram. The vertical blue lines are the times. So you can say that I want only the left and right side of the blue blocks.
Sorry for my bad english, I’m a german guy.
Wish you a safe Christmas. 🙂
Thanks Paul.
- Labels:
-
Programming
- Mark as New
- Bookmark
- Subscribe
- Mute
- Subscribe to RSS Feed
- Permalink
- Notify Moderator
Like so
I've just noticed you want it for all three. The code above just chooses the very first and the very last. However, by putting in some extra logic conditions, and introducing t3,t4,t5 and t6, you should be able to modify the above to get what you want.
Alan
- Mark as New
- Bookmark
- Subscribe
- Mute
- Subscribe to RSS Feed
- Permalink
- Notify Moderator
Here is one way to do it.
The stacking of 0 in front and at the end of the created vector is only done in case that the first or last value of the data is already/still greater than GW.
The routine will not catch a single peak value (just one data value over GW surrounded by lower values).
Ein Frohes Fest und schöne Feiertage (trotz hartem Lockdown)!


