
Turn on suggestions
Auto-suggest helps you quickly narrow down your search results by suggesting possible matches as you type.
Showing results for
Turn on suggestions
Auto-suggest helps you quickly narrow down your search results by suggesting possible matches as you type.
Showing results for
Community Tip - New to the community? Learn how to post a question and get help from PTC and industry experts! X
Options
- Subscribe to RSS Feed
- Mark Topic as New
- Mark Topic as Read
- Float this Topic for Current User
- Bookmark
- Subscribe
- Mute
- Printer Friendly Page
Printing issue (with protected areas) in Mathcad Prime v4
Apr 27, 2018
11:08 AM
- Mark as New
- Bookmark
- Subscribe
- Mute
- Subscribe to RSS Feed
- Permalink
- Notify Moderator
Apr 27, 2018
11:08 AM
Printing issue (with protected areas) in Mathcad Prime v4
Hello,
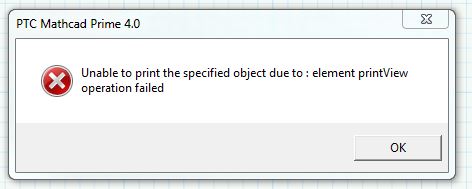
I have found an issue with printing in Mathcad Prime (v4. registered version). Mathcad CANNOT print a worksheet that has "included worksheets" containing "password protected areas", and threw an error as shown in the attached jpg. if I unprotect all the areas in referring worksheets and include them again, the worksheet will be able to be printed out successfully. I have attached two worksheets to this post. worksheet 2 has a password protected area, and worksheet 1 refer to worksheet 2. If you try to print worksheet 1, you will see the printing error.
Is there anyone having this issue before? Please help me!
Thank you
Thai
Solved! Go to Solution.
Labels:
- Labels:
-
Other
45 REPLIES 45
Aug 06, 2018
03:48 PM
- Mark as New
- Bookmark
- Subscribe
- Mute
- Subscribe to RSS Feed
- Permalink
- Notify Moderator
Aug 06, 2018
03:48 PM
@wikidam wrote:
Nick with PTC has just told me "we're looking at a release date of August 14th!".
Did he say which year?
Aug 15, 2018
12:39 PM
- Mark as New
- Bookmark
- Subscribe
- Mute
- Subscribe to RSS Feed
- Permalink
- Notify Moderator
Aug 15, 2018
12:39 PM
Aug 15, 2018
01:31 PM
- Mark as New
- Bookmark
- Subscribe
- Mute
- Subscribe to RSS Feed
- Permalink
- Notify Moderator
Aug 15, 2018
01:31 PM
@wikidam wrote:
Finally, Mathcad v5 has been released today
https://www.ptc.com/en/products/mathcad/new-release
Yes, very disappointing how they "integrated" that third party plot tool!
The format menu (a separate window, not integrated in Primes menu structure) ever so often hides behind the Prime window has has to be searched. Furthermore it opens very slow.
The maximal font size for labels and axis numbers is 20 pt - to low for me on my 4K screen with high windows zoom. The applet does not scale correctly.
Here is what I see on screen (first plot with original font size 8pt, second with maximum of 20 pt)

and here is what I see when I print

You may also notice that on the ordinate we have a different number of ticks on screen and in print without me changing anything! This sure should not happen.
You may also notice the ridiculous small arrows - rather unusable!
Furthermore the highly praised third party module seems not be able to number in multiples of pi on the abscissa - at least I found no option in the unnecessary confusing menu to do so.
Speaking of number of tickmarks: In the original prime plot we are at least able to provide the first, second and last value on any axis also in form of Mathcad variables and that way can create plots with dynamically changing grid depending on input values. The new Plot component only allows to provide first and last value of every axis by Mathcad variables. The number of intervals can only be changed via this horrible menu and cannot be changed dynamically (again: at least i was not able to find an option to do so).
In summary release 5 of Prime is as big a disappointment as the versions before. They worked 2 years (integration of the third party plot tool was already promised for Prime 4) just to be able to present what we see now? A very sloppily "integrated" sure not top notch third party tool which interacts with Mathcad only very rudimentary and is not properly integrated in Prime menu structure? Thats really poor.
Aug 15, 2018
03:04 PM
- Mark as New
- Bookmark
- Subscribe
- Mute
- Subscribe to RSS Feed
- Permalink
- Notify Moderator
Aug 15, 2018
03:04 PM
Couple of points:-
1) Not sure why PTC went with the external format window but I guess it was to give more ability to integrate more sophisticated plotting options. Hopefully the format window will be integrated into Prime window structure in future releases 🙂 I any case, it was clear that the 2D plot will use an external window and I really do not mind. I was so desperate for a better 2D plotting feature so much that I didn't mind. However, it will truly suck if it is too slow. I have the feeling that Prime is already just generally way slower than classic Mathcad. Having a plotting feature that is slower when opening will just suck.
2) I might be wrong but I think it was mentioned in a webinar video that the font size for the axis labels could also be manually increased. And according to the webinar, the axis fonts could be easily manually formatted to whatever taste. They just had a limit for the standard settings which can be overwritten by the user as wished. But again, I might be wrong. Will check out the link for the webinar and share here.
3) The difference in the number of ticks on the ordinate between screen version and print version is weird. You might wanna double check that. May be you are missing something?
4) The arrows do look ridiculously small. I wish one could increase them. However, I am not so worried about them. I don't think the classic Mathcad had better arrows either or even Excel...Excel doesn't have arrows as well. So the arrows do not bother me so much. What I hope is possible, is to have the graph in a "box" i.e It should not only be possible to edit or add the normal "X-Y" axis lines but I hope it is possible to add "opposite" axis lines such such that the lot has 4 editable side....one should thus be able to edit the "4 axes"such that there is a configurable enboxing or enclosing of the graphing area.
5) Sucks that one can't plot multiples of pi on the abscissa 😞 Though I must confess that I rarely use this option. So it should not bother me so much. Hopefully there is an option to change this that we do not yet know of.
6) I still have problems setting dynamic axis limits in the horrible plotting feature of prime 4. I had hoped that prime 5 will fix this. In prime 4, once I formatted the axis limits, it was a nightmare changing that formatting again. In many cases, I had to delete the whole graph and replot again and then reformat. From what you are saying, it seems like formatting axis limits is still a nightmare in prime 5 with the new plotting tool 😞 The webinar I watched seemed to indicate otherwise...it seemed to indicate a more dynamic way to edit the axes limits. Hope we are missing something and it is truly better...
7) Finally, what do you think about grid lines? Especially grid lines for logarithmic scale? I haven't tried the just released version yet. I will only be able to try in a few days. So may be someone can test the grid lines for normal scaling as well as logarithmic scaling and share with us screenshot as well as their assessment. Also how do logarithmic scales look like with prime 5? What about your assessment of labels, plot titles, legends, curve lines and markings their editing and customization, graph fonts, multiple curves on one plot, secondary plotting axes etc? Those aspects should be tested and appreciated or criticized because those are the things we all missed with prime 4
Regards
Aug 15, 2018
03:46 PM
- Mark as New
- Bookmark
- Subscribe
- Mute
- Subscribe to RSS Feed
- Permalink
- Notify Moderator
Aug 15, 2018
03:46 PM
Sure the new plot component offers a lot of options and so it would have been difficult to integrate them all in the horrrible ribbon menu. But 2 years should have been time enough for the developers to think about a different kind of menu, maybe additional like more convenient situation dependent right click menus, floating tool bars, etc.
I guess the plot itself isn't that slow (haven't tried something more complex, though), its just that there is a slightly annoying time delay after double clicking the plot region and the menu window fully opening. And yes, you are right, Prime still is slower than old Mathcad. Furthemore the missing right click menus, not working keyboard shortcuts for foreign keyboard layouts and the missing floating toolbar slow down overall workflow.
There seems to be definitely no way to set a font size greater than 20 pt. I can type in a larger number in the appropriate box but it immediately changes back to 20. While 20pt seems to be OK for axis numbers, the same same limit also applies to chart label and there its definitely way too small.
The reason why the font and the arrows look that small sure is because I use a notebook 4K display and therefore have the windows zoom set to 250% and sometimes 300%. A windows application should scale accordingly but the plot component doesn't. I guess on a "normal" screen with much lower windows zoom the font size will look OK and 20pt will look really way too huge 😉
According to arrows - you are right, neither Excel nor old Mathcad had them. I like the arrows and a plot for me is incomplete without. Seems to be local habit - we usually also use axes crossing at 0/0 and not the boxed view.
So I was happy with the axes in Prime (I wasn't happy with the rest of the plot "features", of course).
Not sure what I should check concerning the difference of number of ticks on screen and in print. There just is a different look.
Many plotting apps aren't able to scale in multiples of pi, some good freeware can. So its not a sign of state of the art for a stand alone plotting tool not to be able to. Sure we can live without 😉
Setting the axis limits and the second value in Prime 4 plots (which still are available in P5) was horrible because of the small font used. But you could write Mathcad variables at all three positions and so set the number of ticks. The new plot component only allows to import minimal and maximal value per axis, but not the second value or the number of intervals. So you can either leave it to Prime to decide how many intervals it choses (which is usually not a good idea) or you set it to a constant value in the components menu, which means that you are not able to change it dynamically depending on some input values or the like.
So yes, you can change the axis limits dynamically but not the number of ticks (same situation as in MC15). Here Prime was one small step ahead.
Gridlines can be set an formatted in various ways (line style, color, subgrid, etc.) Look quite complete.
Logarithmic scaling can be set in the menu for all axis - here is a first try with grids and I don't like the look. Maybe with some more work it could be formatted to look better. All fonts are set to max by the way 😞

Aug 15, 2018
04:27 PM
- Mark as New
- Bookmark
- Subscribe
- Mute
- Subscribe to RSS Feed
- Permalink
- Notify Moderator
Aug 15, 2018
04:27 PM
Thanks for the update. Really helpful.
I think if one invests the time and does well formatted templates, then one could hopefully have really nice plots with the new 2D plot feature...Hopefully.
From the screenshot you sent, it seems that the 2D plot feature uses the annoying scientific numbering format for the axis rather than the power format. I hope that this can be changed but I already hate this scientific numbering format from Excel so much. I prefer the power numbering format. Anyways, we'll see.
Aug 15, 2018
04:56 PM
- Mark as New
- Bookmark
- Subscribe
- Mute
- Subscribe to RSS Feed
- Permalink
- Notify Moderator
Aug 15, 2018
04:56 PM
No fear, you can format the numbers in various ways as usual:

I am not sure if the settings of the plot component can be stored as default in a template or if you would have to embed a demo preformatted plot component in the template which would be a bit uncomfortable.
Aug 15, 2018
05:05 PM
- Mark as New
- Bookmark
- Subscribe
- Mute
- Subscribe to RSS Feed
- Permalink
- Notify Moderator
Aug 15, 2018
05:05 PM
I still do not see the 10^n notation on the drop down menu from the screenshot you sent.
Aug 15, 2018
07:01 PM
- Mark as New
- Bookmark
- Subscribe
- Mute
- Subscribe to RSS Feed
- Permalink
- Notify Moderator
Aug 15, 2018
07:01 PM
Ah, I see! I misunderstood what you were moaning about.
Guess I've bad news for you.
BTW, I dislike this notation, too
Aug 15, 2018
03:10 PM
- Mark as New
- Bookmark
- Subscribe
- Mute
- Subscribe to RSS Feed
- Permalink
- Notify Moderator
Aug 15, 2018
03:10 PM
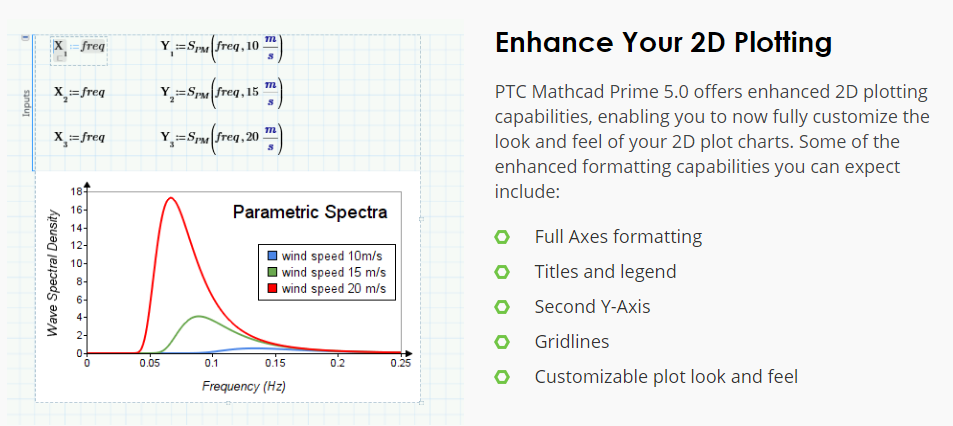
According to this screenshot from PTC's news release, some of my questions have been answered. We do have a secondary axis. The arrows and fonts there look larger. May be someone can check in detail and share with us 🙂

Aug 15, 2018
03:51 PM
- Mark as New
- Bookmark
- Subscribe
- Mute
- Subscribe to RSS Feed
- Permalink
- Notify Moderator
Aug 15, 2018
03:51 PM
@jmebara wrote:
We do have a secondary axis. The arrows and fonts there look larger.
Correct, secondary y-axis exists.
The better font size and arrow size is due to the fact, that the screenshot was taken from a windows installation with a windows zoom around 100%, maybe 120%. As explained in my answer before I am using a high resolution (4K), but small (15,6") screen and have the windows display zoom set to 250% to 300%. The problem is that the plot applet does not respect this setting and does not scale accordingly.
Aug 15, 2018
04:23 PM
- Mark as New
- Bookmark
- Subscribe
- Mute
- Subscribe to RSS Feed
- Permalink
- Notify Moderator
Aug 15, 2018
04:23 PM
🙂 I see...Ok, now I understand.
Jul 26, 2018
01:07 PM
- Mark as New
- Bookmark
- Subscribe
- Mute
- Subscribe to RSS Feed
- Permalink
- Notify Moderator
Jul 26, 2018
01:07 PM
![]()
Why all the decimal points behind the v5? Do they wanna stick with v5 for like a 1000 years and keep on doing minor updates?
Jul 26, 2018
02:18 PM
- Mark as New
- Bookmark
- Subscribe
- Mute
- Subscribe to RSS Feed
- Permalink
- Notify Moderator
Jul 26, 2018
02:18 PM
@jmebara wrote:
Why all the decimal points behind the v5? Do they wanna stick with v5 for like a 1000 years and keep on doing minor updates?
Maybe windows 10 effect. There never will be a Prime 6.
Its not necessary to change the major version number as all licenses have a time limit, subscription only. So no need to release new major versions in regular intervals to keep people paying.
Jul 26, 2018
02:31 PM
- Mark as New
- Bookmark
- Subscribe
- Mute
- Subscribe to RSS Feed
- Permalink
- Notify Moderator
Jul 26, 2018
02:31 PM
If it's subscription only, no need to release any updates at all ![]() . If you want access to your worksheets, you have to keep paying.
. If you want access to your worksheets, you have to keep paying.
Jul 26, 2018
04:18 PM
- Mark as New
- Bookmark
- Subscribe
- Mute
- Subscribe to RSS Feed
- Permalink
- Notify Moderator
Jul 26, 2018
04:18 PM
This numbering came from Creo:

- « Previous
-
- 1
- 2
- Next »

