
Turn on suggestions
Auto-suggest helps you quickly narrow down your search results by suggesting possible matches as you type.
Showing results for
Turn on suggestions
Auto-suggest helps you quickly narrow down your search results by suggesting possible matches as you type.
Showing results for
Community Tip - You can Bookmark boards, posts or articles that you'd like to access again easily! X
Options
- Subscribe to RSS Feed
- Mark Topic as New
- Mark Topic as Read
- Float this Topic for Current User
- Bookmark
- Subscribe
- Mute
- Printer Friendly Page
How to plot samplings data
Jun 06, 2013
05:26 PM
- Mark as New
- Bookmark
- Subscribe
- Mute
- Subscribe to RSS Feed
- Permalink
- Notify Moderator
Jun 06, 2013
05:26 PM
How to plot samplings data
Hi. How do i plot samplings data in Mathcad. Something like this:
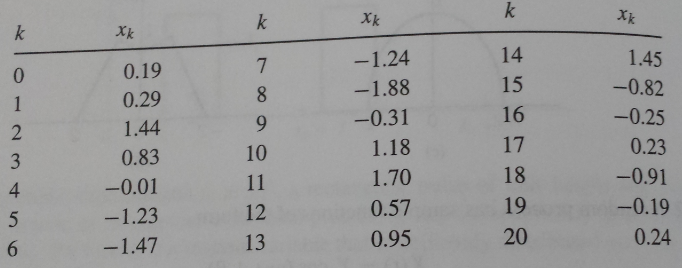
I want to plot all 20 samplings
Thanks in advance
Solved! Go to Solution.
Labels:
- Labels:
-
Statistics_Analysis
1 ACCEPTED SOLUTION
Accepted Solutions
Jun 06, 2013
08:13 PM
- Mark as New
- Bookmark
- Subscribe
- Mute
- Subscribe to RSS Feed
- Permalink
- Notify Moderator
Jun 06, 2013
08:13 PM
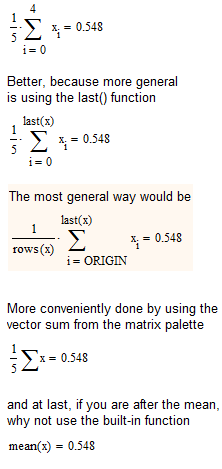
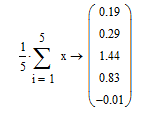
You are adding the vector x 5 times, so you get the 5-fold vector and when you divide it by 5 you end up with the original vector.
What you had in mind was summing up the single elements of the vector you get hold on using the vector subscript ([). But you have to be aware that Mathcad by default would begin indexing with zero, so you would sum up from i=0 to 4.
4 REPLIES 4
Jun 06, 2013
05:53 PM
- Mark as New
- Bookmark
- Subscribe
- Mute
- Subscribe to RSS Feed
- Permalink
- Notify Moderator
Jun 06, 2013
05:53 PM
Osman,
You need to enter your X-data into an array, define k as a range to index that array, and then plot X versus k.
See attached example.
Regards,
Luc
Jun 06, 2013
06:01 PM
- Mark as New
- Bookmark
- Subscribe
- Mute
- Subscribe to RSS Feed
- Permalink
- Notify Moderator
Jun 06, 2013
06:01 PM
Hi LucMeekes
Thanks for the reply
When i do this, i use the sample mean formula for calculating the sample mean value. But Mathcad shows all 20 values:
Jun 06, 2013
08:13 PM
- Mark as New
- Bookmark
- Subscribe
- Mute
- Subscribe to RSS Feed
- Permalink
- Notify Moderator
Jun 06, 2013
08:13 PM
You are adding the vector x 5 times, so you get the 5-fold vector and when you divide it by 5 you end up with the original vector.
What you had in mind was summing up the single elements of the vector you get hold on using the vector subscript ([). But you have to be aware that Mathcad by default would begin indexing with zero, so you would sum up from i=0 to 4.
Jun 06, 2013
08:42 PM
- Mark as New
- Bookmark
- Subscribe
- Mute
- Subscribe to RSS Feed
- Permalink
- Notify Moderator
Jun 06, 2013
08:42 PM
you are a genius !. Thank you so much !

