Turn on suggestions
Auto-suggest helps you quickly narrow down your search results by suggesting possible matches as you type.
Showing results for
Turn on suggestions
Auto-suggest helps you quickly narrow down your search results by suggesting possible matches as you type.
Showing results for
Community Tip - You can Bookmark boards, posts or articles that you'd like to access again easily! X
Options
- Subscribe to RSS Feed
- Mark Topic as New
- Mark Topic as Read
- Float this Topic for Current User
- Bookmark
- Subscribe
- Mute
- Printer Friendly Page
I'm trying to create a continuous function with some added delta's.
Jul 16, 2013
05:38 PM
- Mark as New
- Bookmark
- Subscribe
- Mute
- Subscribe to RSS Feed
- Permalink
- Notify Moderator
Jul 16, 2013
05:38 PM
I'm trying to create a continuous function with some added delta's.
Please look at the attached worksheet (M15) ... I'm new at programming and I'm having difficulty getting the hang of it.
Can constants (scalars, vectors) that are defined outside the program block be referenced inside the program block and vice versa?
Also, what exactly is the purpose of the 'return' command? ... seems like it can be left off sometimes. What in this case would I return?
Thanks for any help.
Jay
Solved! Go to Solution.
Labels:
- Labels:
-
Physics
1 ACCEPTED SOLUTION
Accepted Solutions
Jul 16, 2013
06:17 PM
- Mark as New
- Bookmark
- Subscribe
- Mute
- Subscribe to RSS Feed
- Permalink
- Notify Moderator
Jul 16, 2013
06:17 PM
Jay Smith wrote:
Please look at the attached worksheet (M15) ... I'm new at programming and I'm having difficulty getting the hang of it.
See attached for a possible solution. Among other things you used the wrong (literal, instead of vector) index and demanded the value 0 at a log scale.
Can constants (scalars, vectors) that are defined outside the program block be referenced inside the program block and vice versa?
You can reference sheet variables in a program, but you cannot change them. In other words, if a variable is on the LHS of an assignment it is considered a local variable of the propgram and is not related to a a sheet variable of the same name. If a variable is referenced on the RHS of an assignment Mathcad will look if there is a local variable with that name and if not it will take the value of the sheet variable with the name. So for a program to change a worksheet variable the only possibility is to assign that variable the result of the program.
Also, what exactly is the purpose of the 'return' command? ... seems like it can be left off sometimes. What in this case would I return?
You can omit the return in every case and just write the expression you want to return. using return is good programming style, though. Furthermore the return statement will terminate execution of the program. If no return is used the program return the last expression value. See at the end of the attached file a simple example.
11 REPLIES 11
Jul 16, 2013
06:17 PM
- Mark as New
- Bookmark
- Subscribe
- Mute
- Subscribe to RSS Feed
- Permalink
- Notify Moderator
Jul 16, 2013
06:17 PM
Jay Smith wrote:
Please look at the attached worksheet (M15) ... I'm new at programming and I'm having difficulty getting the hang of it.
See attached for a possible solution. Among other things you used the wrong (literal, instead of vector) index and demanded the value 0 at a log scale.
Can constants (scalars, vectors) that are defined outside the program block be referenced inside the program block and vice versa?
You can reference sheet variables in a program, but you cannot change them. In other words, if a variable is on the LHS of an assignment it is considered a local variable of the propgram and is not related to a a sheet variable of the same name. If a variable is referenced on the RHS of an assignment Mathcad will look if there is a local variable with that name and if not it will take the value of the sheet variable with the name. So for a program to change a worksheet variable the only possibility is to assign that variable the result of the program.
Also, what exactly is the purpose of the 'return' command? ... seems like it can be left off sometimes. What in this case would I return?
You can omit the return in every case and just write the expression you want to return. using return is good programming style, though. Furthermore the return statement will terminate execution of the program. If no return is used the program return the last expression value. See at the end of the attached file a simple example.
Jul 17, 2013
08:25 AM
- Mark as New
- Bookmark
- Subscribe
- Mute
- Subscribe to RSS Feed
- Permalink
- Notify Moderator
Jul 17, 2013
08:25 AM
Werner,
Wow, thank-you very much for your informative reply. I appreciate your time, efforts and suggestions. Sorry for leaving that log 0 reference, I certainly know better but must have been a 'residue' of my many frustrated troubleshooting attempts and just didn't get restored before I shipped it off. I did try my program using both literal and vector subscripts and, of course, neither worked. From your correct and functioning example, I'm thinking that the 'if comparison' im my program statement would never evaluate as equal with literals or vector subscripts and hence the 'otherwise' zero values with no spikes. So, in my approach, I guess the x= comparison statement was not working as intended because I was trying to compare a single value of 'x' to 4 potential 'k-defined' variables ; i.e. a 1x4 vector or 4 discrete values depending on how the varible subscript was defined. Is this correct reasoning or am I still missing the point? BTW, I appreciate the simplicity of your approach and it's hard to argue with success but I just want to better understand what the program was 'thinking' with my approach in a similiar way that you explained the return command function. Also, thank-you for the quick-plot implementation explanations and suggestions.
Thanks,
Jay
Jul 17, 2013
10:06 AM
- Mark as New
- Bookmark
- Subscribe
- Mute
- Subscribe to RSS Feed
- Permalink
- Notify Moderator
Jul 17, 2013
10:06 AM
Jay Smith wrote:
Werner,
Wow, thank-you very much for your informative reply. I appreciate your time, efforts and suggestions. Sorry for leaving that log 0 reference, I certainly know better
You are welcome. I was sure you would have spotted the zero if you would get the function to run.
I'm thinking that the 'if comparison' im my program statement would never evaluate as equal with literals or vector subscripts and hence the 'otherwise' zero values with no spikes.
No, the reason your plot failed was because of the zero at the ordinate and the log scale. Your routine would return the last spike only no matter if you use literal or vector subscripts (but for different reasons). But even if you would have changed the zero to a one on the x-axis, you would not have seen the spike beacuse of the number of point limitation of the quickplot. But you can test it and you will see the f(16000) is the only value different from zero.
So lets see why this is so:
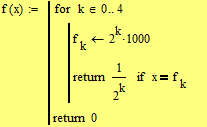
1) literal subscript: The k in the subscript has nothing to do with the k of the for-loop. So you calculate 5 times a value and assign it the same variable, overwriting one value with the next - the last one (16000) wins. So f.k has a value of 16000 and then you compare x against f.k. Only if x is 16000 you assign a nonzero value.
2) vector subscript: this time the for-loop really creates a 5x1 vector. The if statement is outside and after the loop. You compare x against f[k. k will have the value 4 after the loop (I wasn't sure about that but I just verified it). So you compare x against f[4 which happens to be 16000 again.
In contrary to what you wrote you don't compare x to the whole vector - you would have to omit the index to do so and would get an error message as a scalar can never be equalt to a vector.
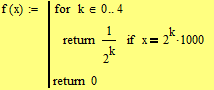
So now one could have the idea to put the x=f[k comparison inside the loop (there would be no need for a vector now) but then you would have to put the otherwise statement in the loop, too. If you don't, you get an error because you used an otherwise w/o corresponding if. Now again, only the last spike would show. If x is 8000, the if statement would assign a nonzero value but the loop goes on and we ask if x is 16000 - answer:no and so we get 0.
There is a way out - we use "break" as soon as we get a match.
Even better, we use the fact, that "return" terminates the program and we get a solution w/o otherwise:
But now it wouldn't make a difference if you use vector or literal subscripts or use any other variable instead of f.k.
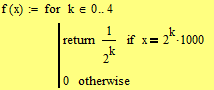
If you think about it closer, we don't need any variable at all as we don't have to keep the value and can calculate it in the comparison directly. That way we get a neat, quick and short solution (the first "return" is mandatory to stop execution, the last one is just good style, I hope).
This post got quite lengthy but I hope it helps and my Englisch is understandable enough.
EDIT: A last one (but I don't prefer it). This time you are not allowed to replace the last "0" with a "return 0"!! You would get the first spike only if you do!
Jul 17, 2013
03:31 PM
- Mark as New
- Bookmark
- Subscribe
- Mute
- Subscribe to RSS Feed
- Permalink
- Notify Moderator
Jul 17, 2013
03:31 PM
Werner,
Thank-you so much for taking the time to share these turorials with me and the examples to back it up. This really helps me understand. If you'll indulge me in another question ... I was tinkering with what you gave me and I noticed that when I changed the 1000 factor to 1000.1 or 999.9 that the spikes dissappeared with the quickplot and the other plot with external ordinate varaible definition (1 .. 10^5). Could you please explain how this ordinate 'mapping' works (quickplot=1000 points, 2^31 points max. for external ordinate ranges, right?). The problems that I'm working with now call for these values to NOT be nice well rounded numbers. I mean I want the axis to be nice even number intervals but the spikes can lie anywhere in between these axis markers in fractional intervals. Also, are log plot ordinates treated differently. Does this mean that I must use narrower ordinate ranges if I want better resolution capability? I often need the spikes to appear at fractional frequencies; i.e. 10^-6 to 10^3 Hz range.
Your English is just fine ... I trust you were just kidding!
Thanks,
Jay
Jul 17, 2013
04:03 PM
- Mark as New
- Bookmark
- Subscribe
- Mute
- Subscribe to RSS Feed
- Permalink
- Notify Moderator
Jul 17, 2013
04:03 PM
To see the spikes you have to ensure that the appropriate x-values are elements of the range variable x.
While to us a function may seem continous, Mathcad will always evaluate it at discrete points only and (at least by default) connects them. If the x-value the spike should appear is not evaluated we won't see it.
This was the problem with the quickplot. You chose beginning and end value (1, 10^5) and Mathcad evenly (I think) distributes 998 values inbetween. Chances are 16000, 8000, etc are NOT amongst them, so the spikes are not seen.
I created a range variable 1,2,...10^5, so all integers are evaluated and we see the spikes as they appear at int values. 10^5 points are far too much points for a plot (thats the reason the plot with the Kronecker function took so long to evaluate), but if you chose 1,10..10^5 you run into problems. x will now be 1,10,19,28,37,... and you probably will not hit all spikes, if any. 10,20..10^5 would do the job, though.
If you change the factor to 1000.1, the spike will appear at 8000.8 and will not be seen therefore with the range variable provided.
At first glance I see three options:
1) make the range variable dependent on the factor to ensure all multiples (or at least the spikes) of the factor will be in the range. Not sure about the best way to do so as a range will be an arithmetic series and we need a geometric one. Guess we would need something like the GCD (but not integer) of the various distances of the spikes as stepwidth in the range. Hmmm ??
2) Instead of a range at the abscissa (I wrote mistakenly ordinate in the last post) and a function at the ordinate you could put precalculated vectors there so you have more control over the positions the function is evaluated
3) Plot the base signal disregarding the spikes and plot the spikes additionally as extra traces like single points formated as stem or using vectors or matrices
With narrower abscissa ranges you will run into troubles (apart from execution time or memory consumption) as there is a limit in Mathcads plot. All the traces together are allowed a maximum of a half million points (not 2^31 as you expected). So if factor is 1000.1 and you chose x:=1,1.1..10^5 you would demand a million points and get an error.
See attached for some way of implementation. Guess method 2) would be preferred.
EDIT: Added geometric series of x-values --> better result with less points.
Jul 17, 2013
06:33 PM
- Mark as New
- Bookmark
- Subscribe
- Mute
- Subscribe to RSS Feed
- Permalink
- Notify Moderator
Jul 17, 2013
06:33 PM
I have added a section 2B) which uses the "original" function f(x) and still shows all spikes.
EDIT: Added a "nearly equal" to section 1 to cope with the rounding errors.
Jul 16, 2013
07:08 PM
- Mark as New
- Bookmark
- Subscribe
- Mute
- Subscribe to RSS Feed
- Permalink
- Notify Moderator
Jul 16, 2013
07:08 PM
Added another way to define the function using the Kronecker Delta.
Jul 17, 2013
08:29 AM
- Mark as New
- Bookmark
- Subscribe
- Mute
- Subscribe to RSS Feed
- Permalink
- Notify Moderator
Jul 17, 2013
08:29 AM
Thank-you for the insights into other available MathCAD function options. I will have to learn more about these.
Jay
Jul 17, 2013
10:26 AM
- Mark as New
- Bookmark
- Subscribe
- Mute
- Subscribe to RSS Feed
- Permalink
- Notify Moderator
Jul 17, 2013
10:26 AM
I think the better solution is in the last post (that with the two "return"s http://communities.ptc.com/message/209610#209610). I don't think that using Kroneckers Delta or the boolean comparison is adviseable here. Especially the sum created for EVERY x-value is quite time consuming as you can see in "evaluating" the plots. In case you don't know - the boolean compare works because in Mathcad true = 1 and false = 0.
Jul 18, 2013
04:03 AM
- Mark as New
- Bookmark
- Subscribe
- Mute
- Subscribe to RSS Feed
- Permalink
- Notify Moderator
Jul 18, 2013
04:03 AM
One test:
Jul 18, 2013
04:51 AM
- Mark as New
- Bookmark
- Subscribe
- Mute
- Subscribe to RSS Feed
- Permalink
- Notify Moderator
Jul 18, 2013
04:51 AM
Hmm, I think I am not able to follow.
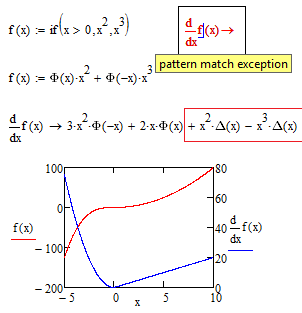
It was discussed here quite often (especially in threads about piecewise continuous functions) that the symbolic processor does not like functions which are defined using "if" (neither the if function, you used, nor the if programming condition), but is happy with Heaviside.
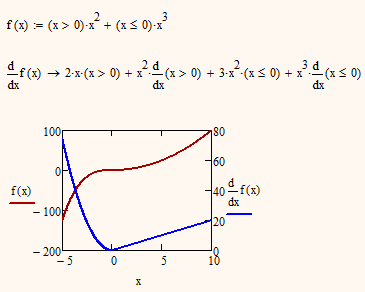
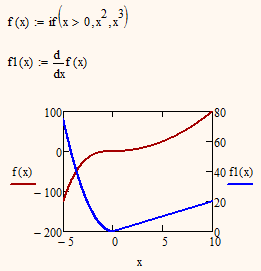
But if the goal is "just" numeric evaluation and graphing of function and derivative, "if" is OK (see pic below).
Only if you need for a specific reason a symbolic result you would have to resort to Heaviside. And one can argue about the usefulness of the Dirac Delta in the derivative. This function is a symbolic function only.
So I don't see how this topic would relate to the subject here, which is about plotting a function with discrete "spikes" (not Dirac's) of different amplitude and ensuring the spikes are all visible in the plot.
Obviously I am missing the point of your post, maybe you can explain the connection.
A last remark: did you know that you can take the symbolic derivative of a function defined with boolean expression?
On has to accept that the dervative of a boolean expression is zero 😉