
Turn on suggestions
Auto-suggest helps you quickly narrow down your search results by suggesting possible matches as you type.
Showing results for
Turn on suggestions
Auto-suggest helps you quickly narrow down your search results by suggesting possible matches as you type.
Showing results for
Community Tip - Your Friends List is a way to easily have access to the community members that you interact with the most! X
Options
- Subscribe to RSS Feed
- Mark Topic as New
- Mark Topic as Read
- Float this Topic for Current User
- Bookmark
- Subscribe
- Mute
- Printer Friendly Page
Something is wrong with contour plots
Sep 07, 2013
08:17 AM
- Mark as New
- Bookmark
- Subscribe
- Mute
- Subscribe to RSS Feed
- Permalink
- Notify Moderator
Sep 07, 2013
08:17 AM
Something is wrong with contour plots
Something is wrong with displaying contour plots in Mathcad 15. Everything works fine only if I create a new plot. A source file ("Contour plot_MC 2000") was created in Mathcad 2000 version. Any ideas?
Labels:
- Labels:
-
Other
13 REPLIES 13
Sep 07, 2013
08:50 AM
- Mark as New
- Bookmark
- Subscribe
- Mute
- Subscribe to RSS Feed
- Permalink
- Notify Moderator
Sep 07, 2013
08:50 AM
Bug confirmed.
Strange thing. The area which is displayed is not adjusted to the size of the matrix.
If you increase the number of points (replace 4*... by 15*...) you begin to see something.
Could not spot any differences in the format options between the old and a newly created plot.
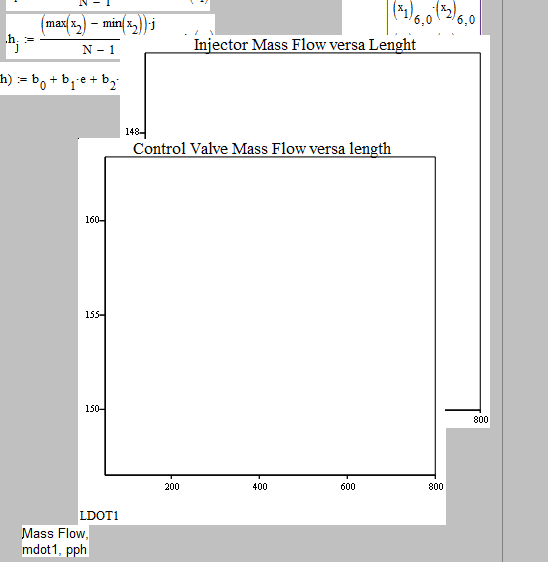
When I select all areas in the sheet and do a format separate regions, I get a lot of display errors like the following. The region "Injector Mass ...." would not be selectable.
Sep 07, 2013
09:16 AM
- Mark as New
- Bookmark
- Subscribe
- Mute
- Subscribe to RSS Feed
- Permalink
- Notify Moderator
Sep 07, 2013
09:16 AM
The same bug occurs in Mathcad 11.0a version.
Sep 07, 2013
10:05 AM
- Mark as New
- Bookmark
- Subscribe
- Mute
- Subscribe to RSS Feed
- Permalink
- Notify Moderator
Sep 07, 2013
10:05 AM
Weird, but it's not normal behavior. Did you create the file in MC2000, or did you get it from somewhere else?
Sep 07, 2013
12:24 PM
- Mark as New
- Bookmark
- Subscribe
- Mute
- Subscribe to RSS Feed
- Permalink
- Notify Moderator
Sep 07, 2013
12:24 PM
I was looking for some calculations on acoustics and found the file here ("Analysis of Acoustic Model"):
http://romanuniverse.com/science/mathcadfiles.htm
http://romanuniverse.com/science/AcousticModel.html
http://romanuniverse.com/science/AcousticModel.mcd
P.S. Сan you test this file in 2000 version?
Sep 07, 2013
01:30 PM
- Mark as New
- Bookmark
- Subscribe
- Mute
- Subscribe to RSS Feed
- Permalink
- Notify Moderator
Sep 07, 2013
01:30 PM
P.S. Сan you test this file in 2000 version?
Only with a huge amount of trouble. I have version 2000 on CD, but it can't coexist with later versions on te same computer.
The contour plot should not have this problem though, so I think the file must be corrupted in some way.
Sep 07, 2013
06:41 PM
- Mark as New
- Bookmark
- Subscribe
- Mute
- Subscribe to RSS Feed
- Permalink
- Notify Moderator
Sep 07, 2013
06:41 PM
The contour plot should not have this problem though, so I think the file must be corrupted in some way.
I don't think so. The problem is the scaling of the x- and y-axis. Set both to autoscale and you get the same as a newly created contourplot would show.
I don't remember and I just had a look at the Mathcad2000 manual without being wiser, but it seems that the contourplot behaved differently in older versions.
We plot a 36x36 matrix and so we only see a plot for 0<=x,y<=35, which does not reflect the true abscissa and ordinate values. In MC15 there is no way to handle that if we plot a matrix. But in MC2000 it was obviously possible to cope with that by manually setting the axis scales (not the quickplot data) - in case of the sheet 50<=x<=800 and 1<=x.<=4. In MC2000 the matrix calues are mapped to that range while in MC15 we don't see anything because the x values are out of the range 0..35. We see that it worked in MC2K by looking at the html-version of the sheet (the second of Valerys links).
In retrospective I like the bahaviour of the older version .
Sep 11, 2013
02:46 AM
- Mark as New
- Bookmark
- Subscribe
- Mute
- Subscribe to RSS Feed
- Permalink
- Notify Moderator
Sep 11, 2013
02:46 AM
Werner Exinger wrote:
...To get the same result in Mathcad 15 ...
Is there a less cumbersome and elaborate way of getting that result?...
Maybe just insert a new contour plot?
Sep 11, 2013
04:51 AM
- Mark as New
- Bookmark
- Subscribe
- Mute
- Subscribe to RSS Feed
- Permalink
- Notify Moderator
Sep 11, 2013
04:51 AM
VladimirN. wrote:
Werner Exinger wrote:
...To get the same result in Mathcad 15 ...
Is there a less cumbersome and elaborate way of getting that result?...
Maybe just insert a new contour plot?
How? A new contour plot still shows just the index numbers for abscissa and ordinate, not the real frequency and range.
Please look more closely at the axis labels/scales to see why all the work was done to create plots which equal the desired result which is seen in the pdfs.
As already written it is quite easy to bring the seemingly bad areas back to life simply by checking autoscaling for the axis - no need to insert a new plot.
If you are happy with the contour plots with wrong labels you can do that, but otherwise I found no other solution than to create those interpoation function to get what we obviously could have much easier with old Mathcad versions.
I don't know in which version the behaviour of the 3D plots was changed and why - I was not even aware that there had been this convenient way in the good old days.
Sep 11, 2013
08:09 AM
- Mark as New
- Bookmark
- Subscribe
- Mute
- Subscribe to RSS Feed
- Permalink
- Notify Moderator
Sep 11, 2013
08:09 AM
I must admit that I do not remember that change to how contour plots work, even now that you have pointed it out.
You can fix the axes by creating x and y matrices, which is easier than the interpolation approach.
Sep 11, 2013
08:45 AM
- Mark as New
- Bookmark
- Subscribe
- Mute
- Subscribe to RSS Feed
- Permalink
- Notify Moderator
Sep 11, 2013
08:45 AM
You can fix the axes by creating x and y matrices, which is easier than the interpolation approach.
Oh yes, you're right. Thats sure much easier to handle.
Sep 08, 2013
07:01 AM
- Mark as New
- Bookmark
- Subscribe
- Mute
- Subscribe to RSS Feed
- Permalink
- Notify Moderator
Sep 08, 2013
07:01 AM
What happens here? I just wanted to edit (just a typo) the above post but when I do I don't see anything below the sentence "In retrospective I like the behaviour of the older version." No text below, no picture!? But I see a blank at the end of the sentence between "version" and ".". So I refrained from editing and updating. Strange. Just a moment before I had problems in another thread adding a fourth pic and suspected a limit, but it seems there is something else wrong. Anybody experiencing similar effects?
Sep 11, 2013
02:47 AM
- Mark as New
- Bookmark
- Subscribe
- Mute
- Subscribe to RSS Feed
- Permalink
- Notify Moderator
Sep 11, 2013
02:47 AM
Have not seen this.
Sep 11, 2013
04:54 AM
- Mark as New
- Bookmark
- Subscribe
- Mute
- Subscribe to RSS Feed
- Permalink
- Notify Moderator
Sep 11, 2013
04:54 AM
Also never experienced such a strange effect before. Tried sometimes after a while again and still the same. Hope it does not occur more often.

