
Turn on suggestions
Auto-suggest helps you quickly narrow down your search results by suggesting possible matches as you type.
Showing results for
Turn on suggestions
Auto-suggest helps you quickly narrow down your search results by suggesting possible matches as you type.
Showing results for
Community Tip - Did you get called away in the middle of writing a post? Don't worry you can find your unfinished post later in the Drafts section of your profile page. X
Options
- Subscribe to RSS Feed
- Mark Topic as New
- Mark Topic as Read
- Float this Topic for Current User
- Bookmark
- Subscribe
- Mute
- Printer Friendly Page
Summing function Wm(time,a,b,c,d) from m=0 to m=n ?
Aug 26, 2014
03:35 AM
- Mark as New
- Bookmark
- Subscribe
- Mute
- Subscribe to RSS Feed
- Permalink
- Notify Moderator
Aug 26, 2014
03:35 AM
Summing function Wm(time,a,b,c,d) from m=0 to m=n ?
To all,
I am sure I saw something about how to do such thing but I cannot find it so needs some pointers
I have a function (see attached mcad sheet) Wm(t,am,bm,cm,dm) where t is time and am,bm,cm,dm are coefficient valid for equation m
I need to do sum of Wm from m =0 to n: 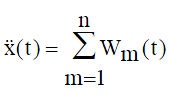 but I am struggling with indices in mcad
Coudl anyone refreshe my memory on this summation? It might be something with "dicretizing" the time 't' if I recall
Thanks
Regards
JXB
Solved! Go to Solution.
Labels:
- Labels:
-
Other
ACCEPTED SOLUTION
Accepted Solutions
Aug 26, 2014
08:47 AM
- Mark as New
- Bookmark
- Subscribe
- Mute
- Subscribe to RSS Feed
- Permalink
- Notify Moderator
Aug 26, 2014
08:47 AM
Thanks to all for the help. Moving on to the next bit of the tool....
14 REPLIES 14
Aug 26, 2014
03:57 AM
- Mark as New
- Bookmark
- Subscribe
- Mute
- Subscribe to RSS Feed
- Permalink
- Notify Moderator
Aug 26, 2014
03:57 AM
Like the attached?
I have change t from a range variable to a vector and also removed the units s the program works.
Aug 26, 2014
03:57 AM
- Mark as New
- Bookmark
- Subscribe
- Mute
- Subscribe to RSS Feed
- Permalink
- Notify Moderator
Aug 26, 2014
03:57 AM
The attached should help.
Alan
Looks like Mike just beat me to it!
Edit: Just noticed that your original file was a .mcd, so I've added a .mcd version here.
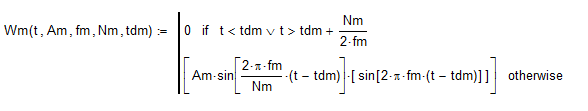
Mike: In your file the definition of Wm still contains tdm < t > tdm+Nm/2fm. I suspect this should be tdm < t < tdm+Nm/2fm (though I could be wrong!).
Aug 26, 2014
04:25 AM
- Mark as New
- Bookmark
- Subscribe
- Mute
- Subscribe to RSS Feed
- Permalink
- Notify Moderator
Aug 26, 2014
04:25 AM
Hi Alan
Thanks for the help. Am I correct to say that the Sum only works for a specific t value and not a range of t. Using Mike suggested method, I reckon that one needs to use two range variables
i for the vectorised time t
m for the number of coefficient (a,b,c,d) to consider
Aug 26, 2014
04:56 AM
- Mark as New
- Bookmark
- Subscribe
- Mute
- Subscribe to RSS Feed
- Permalink
- Notify Moderator
Aug 26, 2014
04:56 AM
J B wrote:
Hi Alan
Thanks for the help. Am I correct to say that the Sum only works for a specific t value and not a range of t. Using Mike suggested method, I reckon that one needs to use two range variables
i for the vectorised time t
m for the number of coefficient (a,b,c,d) to consider
The sum as written only works for a specific value of t, but you could include this sum within another that summed over the values of t.
Alan
Aug 26, 2014
05:10 AM
- Mark as New
- Bookmark
- Subscribe
- Mute
- Subscribe to RSS Feed
- Permalink
- Notify Moderator
Aug 26, 2014
05:10 AM
Am I correct to say that the Sum only works for a specific t value and not a range of t.
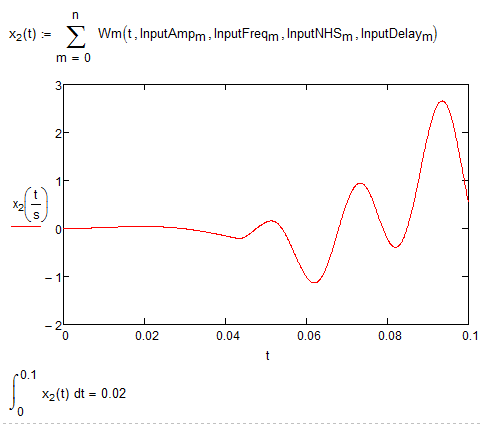
It depends on what you are hunting for. As I suppose from the inserted pic you want to define a function for the second derivative of x like shown below, but I may be wrong.
And of course you may "sum" over t by using an integral.
But to be honest its unclear to me what you are really after.
Aug 26, 2014
05:50 AM
- Mark as New
- Bookmark
- Subscribe
- Mute
- Subscribe to RSS Feed
- Permalink
- Notify Moderator
Aug 26, 2014
05:50 AM
Hi Werner
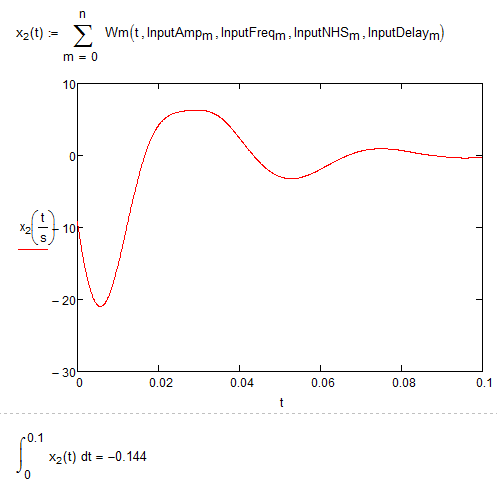
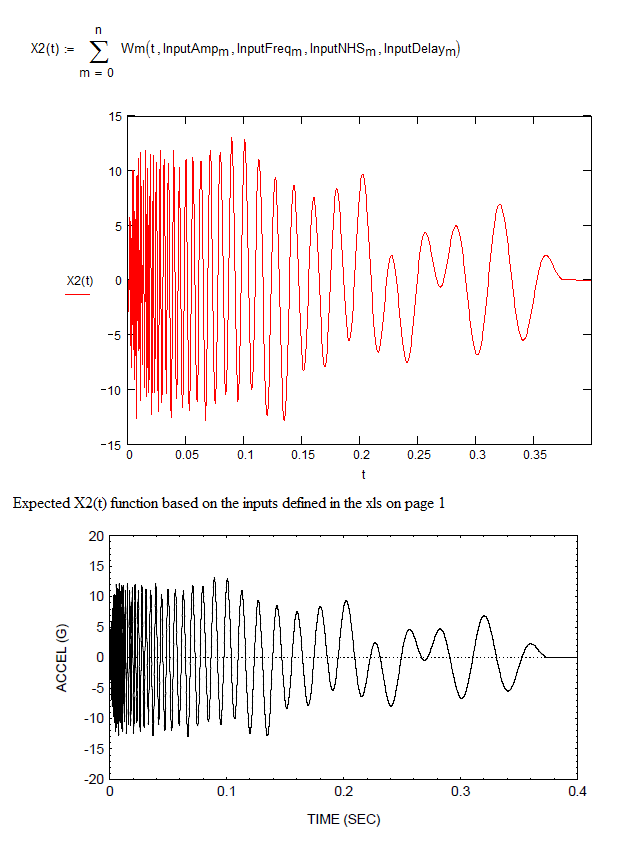
The function Wm is the wavelet function and as essentially 5 "variables", t(ime) and a,b,c,d coefficients. The idea is to define m sets of coefficients (a to d) and create a new function x2(t) which is the sum of all the Wm functions. A bit like a fourier series if you want
Will attach an updated mcad sheet based on all the inputs so far very shortly.
Regards
JXB
Aug 26, 2014
04:31 AM
- Mark as New
- Bookmark
- Subscribe
- Mute
- Subscribe to RSS Feed
- Permalink
- Notify Moderator
Aug 26, 2014
04:31 AM
AlanStevens wrote:
The attached should help.
Alan
Looks like Mike just beat me to it!
Edit: Just noticed that your original file was a .mcd, so I've added a .mcd version here.
Mike: In your file the definition of Wm still contains tdm < t > tdm+Nm/2fm. I suspect this should be tdm < t < tdm+Nm/2fm (though I could be wrong!).
Hi Alan,
I was a little unsure on this myself, but the tdm condition ' < t > tdm+Nm/2fm ' does return a few 'True' evaluations so I left it as it is. JXB can you clarify?
Aug 26, 2014
05:03 AM
- Mark as New
- Bookmark
- Subscribe
- Mute
- Subscribe to RSS Feed
- Permalink
- Notify Moderator
Aug 26, 2014
05:03 AM
Mike Armstrong wrote:
AlanStevens wrote:
The attached should help.
Alan
Looks like Mike just beat me to it!
Edit: Just noticed that your original file was a .mcd, so I've added a .mcd version here.
Mike: In your file the definition of Wm still contains tdm < t > tdm+Nm/2fm. I suspect this should be tdm < t < tdm+Nm/2fm (though I could be wrong!).
Hi Alan,
I was a little unsure on this myself, but the tdm condition ' < t > tdm+Nm/2fm ' does return a few 'True' evaluations so I left it as it is. JXB can you clarify?
It will evaluate to "true" only when t is greater than the larger of the two conditions.
Alan
Aug 26, 2014
05:11 AM
- Mark as New
- Bookmark
- Subscribe
- Mute
- Subscribe to RSS Feed
- Permalink
- Notify Moderator
Aug 26, 2014
05:11 AM
AlanStevens wrote:
Mike Armstrong wrote:
AlanStevens wrote:
The attached should help.
Alan
Looks like Mike just beat me to it!
Edit: Just noticed that your original file was a .mcd, so I've added a .mcd version here.
Mike: In your file the definition of Wm still contains tdm < t > tdm+Nm/2fm. I suspect this should be tdm < t < tdm+Nm/2fm (though I could be wrong!).
Hi Alan,
I was a little unsure on this myself, but the tdm condition ' < t > tdm+Nm/2fm ' does return a few 'True' evaluations so I left it as it is. JXB can you clarify?
It will evaluate to "true" only when t is greater than the larger of the two conditions.
Alan
Agree.
Which is does from row 951 onwards
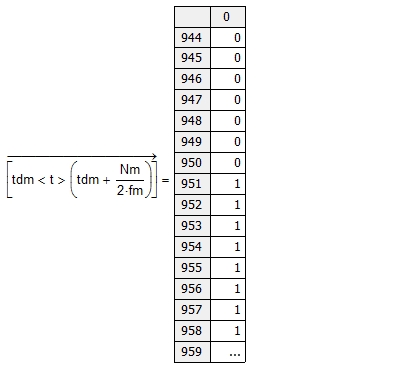
I think the way you have it is the correct way, but confirmation by JXB would be beneficial.
Aug 26, 2014
05:44 AM
- Mark as New
- Bookmark
- Subscribe
- Mute
- Subscribe to RSS Feed
- Permalink
- Notify Moderator
Aug 26, 2014
05:44 AM
Clarification for < t > statment. I changed to an OR statment. Will attahced a ver2 of the mcad sheet soon
Aug 26, 2014
06:04 AM
- Mark as New
- Bookmark
- Subscribe
- Mute
- Subscribe to RSS Feed
- Permalink
- Notify Moderator
Aug 26, 2014
06:04 AM
J B wrote:
Clarification for < t > statment. I changed to an OR statment. Will attahced a ver2 of the mcad sheet soon
OK, that changes the sum function, too, of coursed. I used Alans version in my previous answer.
You may alternatively define

Can you clarify your need concerning that sum?
Aug 26, 2014
06:48 AM
- Mark as New
- Bookmark
- Subscribe
- Mute
- Subscribe to RSS Feed
- Permalink
- Notify Moderator
Aug 26, 2014
06:48 AM
Werner
The sum of the Wm(t) functions creates a time signal/histort based on Shock Response Spectrum (SRS) specification. If one takes the time signal and convert it to an SRS (response of 1-DoF spring-mass system to the created time history) then one should get the "same-ish" SRS. The clever bit (which I haven't figures out!) is to create a (large enought) set of coefficients (a,b,c,d) to create this time history.
Aug 26, 2014
08:07 AM
- Mark as New
- Bookmark
- Subscribe
- Mute
- Subscribe to RSS Feed
- Permalink
- Notify Moderator
Aug 26, 2014
08:07 AM
J B wrote:
Werner
The sum of the Wm(t) functions creates a time signal/histort based on Shock Response Spectrum (SRS) specification. If one takes the time signal and convert it to an SRS (response of 1-DoF spring-mass system to the created time history) then one should get the "same-ish" SRS. The clever bit (which I haven't figures out!) is to create a (large enought) set of coefficients (a,b,c,d) to create this time history.
Comparing the two plots I guess you got what you had asked for. You may consider adding units throughout. You simply have to type something like InputFreq:=InputFreq*Hz, etc. after you exctracted the values from your table.
Aug 26, 2014
08:47 AM
- Mark as New
- Bookmark
- Subscribe
- Mute
- Subscribe to RSS Feed
- Permalink
- Notify Moderator
Aug 26, 2014
08:47 AM
Thanks to all for the help. Moving on to the next bit of the tool....

