- Community
- ThingWorx
- ThingWorx Developers
- Re: Anomaly Alert against a Square Wave Experiment
- Subscribe to RSS Feed
- Mark Topic as New
- Mark Topic as Read
- Float this Topic for Current User
- Bookmark
- Subscribe
- Mute
- Printer Friendly Page
Anomaly Alert against a Square Wave Experiment
- Mark as New
- Bookmark
- Subscribe
- Mute
- Subscribe to RSS Feed
- Permalink
- Notify Moderator
Anomaly Alert against a Square Wave Experiment
Hi community,
I've been doing some experiments with the Anomaly Alert module to understand what are its capabilities and limitations.
Dataset
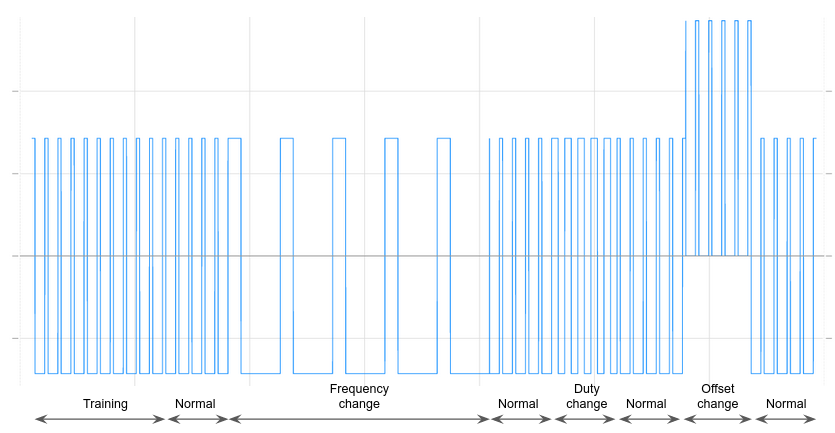
In particular, I've tested it with an emulated square signal that changes its characteristics over time against different anomaly alert configuration parameters to see how well the anomaly alert detects those changes. Below an image of the signal dataset.
From left to right that is:
- 10 cycles of normal behavior (for training)
- 5 cycles of normal behavior
- 5 cycles at a different frequency (f_anomalus = f_normal/4)
- 5 cycles of normal behavior
- 5 cycles with a duty=0.5
- 5 cycles of normal behavior
- 5 cycles with an offset=1
- 5 cycles of normal behavior
Each cycle has 200 points (except for the f_anomalus cycles that have four times more points) and the property value change is configured to Always, so that each time the signal is 'sampled' a record is logged.
Experiments
I configured the Anomaly Alert parameters taking into account the signal update rate, the number of points per cycle and the number of cycles that the parameter needs. Expressing that into formulas:
Outbound Anomaly Rate = points_per_cycle * update_rate * number_of_cycles
Min. Data Collection Time = points_per_cycle * update_rate * number_of_cycles
I also tested changing the certainty value (95, 97.5 and 99) while keeping the other parameters fixed.
Results
All the experiment results looked almost the same.
- Changing the Certainty value had no effect.
- The only difference was noticed when the Outbound Anomaly Rate changed - the best result was detecting just one false positive (instead of two or three false positives) in the transition between Training and Monitoring states when the outbound anomaly rate was set equal to 0.5cycle
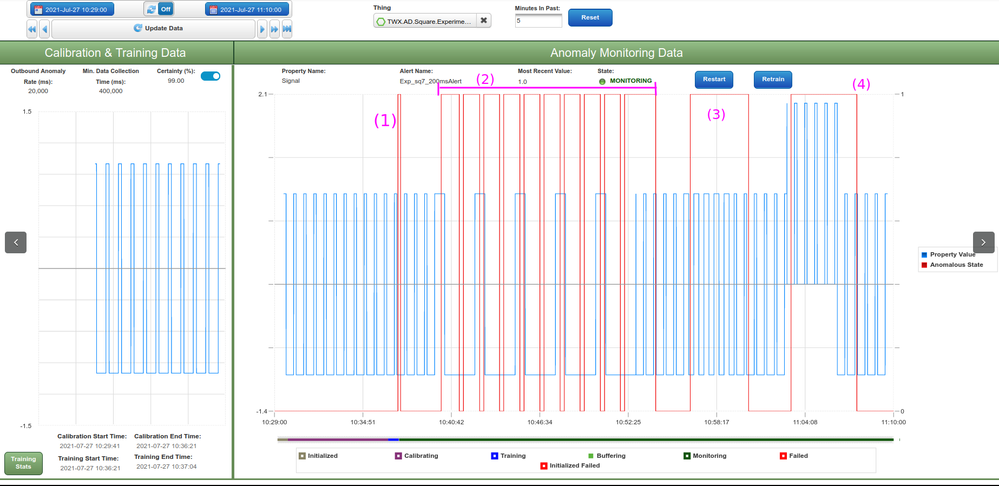
Here a screenshot of the result (experiment sq7):
It can be seen that the Anomaly Alert:
- (1) and (2): Did not work okay when switching from Training to Monitoring and when the signal frequency changed.
- (3) and (4). Worked okay when detecting the change of duty and when the offset was added.
So, the questions are:
- How could the false positive when switching from Training to Monitoring (1) be eliminated?
- Looking at (2), how can the Anomaly Alert stay in the the Anomalous State until the signal changes its frequency back to the normal value? Which Anomaly Alert parameter should be updated?
- If accessible, could the 50% value mentioned in the Outbound Anomaly Rate documentation be updated?
Kind regards,
Nahuel
Solved! Go to Solution.
- Labels:
-
Analytics
Accepted Solutions
- Mark as New
- Bookmark
- Subscribe
- Mute
- Subscribe to RSS Feed
- Permalink
- Notify Moderator
@nahuel ,
I spoke with some of our Analytics Consultants that handle solution based items. My ability to assist is limited to application based issues, but here is what I can provide from the Analytics Consultants:
Your implementation of AD has done a relatively good job of finding things while raising questions. This is a good place to start with describing what you are seeing and understanding the behavior of what you are observing.
We are not sure why in (1) that there was an Anomaly Detected, unless there was some minor change in the underlying data or a hiccup with the stream. Assuming that the Anomalous section was exactly like the Training, then this should have not been marked as an Anomaly.
For (2), this should have been a big continuous anomaly, but instead it was marked as many small anomalies. This is ok in some ways, as it provides an indication that something is indeed different. When reviewed why this was split into many anomalies, which we can explain with the following: a predictive model is trained on training data then used to predict next point in time based on a window. The predictive model says that if it saw 0's for a certain interval, then the next value is likely to be 0 (as in the 0 segments in training). This is why it finds certain areas of (2) to be normal (non-anomalous).
If you want to read up more on Anomaly Detection from one of our Analytics Consultants published Tech Tips, please review this post here: https://community.ptc.com/t5/IoT-Tech-Tips/Anomaly-Detection-concepts-techniques-and-Thingworx-support/m-p/626317
As this is a solutions based concept and topic, I would highly encourage you to speak with your PTC Software Sales rep or Client Success Manager about enablement or solution design assistance if you have additional implementation questions for your deployment of Anomaly Detection.
Regards,
Neel
- Mark as New
- Bookmark
- Subscribe
- Mute
- Subscribe to RSS Feed
- Permalink
- Notify Moderator
@nahuel ,
Thank you for posting your question to the PTC Community.
We are currently reviewing this post and will have feedback as soon as possible.
Regards,
Neel
- Mark as New
- Bookmark
- Subscribe
- Mute
- Subscribe to RSS Feed
- Permalink
- Notify Moderator
@nahuel ,
I spoke with some of our Analytics Consultants that handle solution based items. My ability to assist is limited to application based issues, but here is what I can provide from the Analytics Consultants:
Your implementation of AD has done a relatively good job of finding things while raising questions. This is a good place to start with describing what you are seeing and understanding the behavior of what you are observing.
We are not sure why in (1) that there was an Anomaly Detected, unless there was some minor change in the underlying data or a hiccup with the stream. Assuming that the Anomalous section was exactly like the Training, then this should have not been marked as an Anomaly.
For (2), this should have been a big continuous anomaly, but instead it was marked as many small anomalies. This is ok in some ways, as it provides an indication that something is indeed different. When reviewed why this was split into many anomalies, which we can explain with the following: a predictive model is trained on training data then used to predict next point in time based on a window. The predictive model says that if it saw 0's for a certain interval, then the next value is likely to be 0 (as in the 0 segments in training). This is why it finds certain areas of (2) to be normal (non-anomalous).
If you want to read up more on Anomaly Detection from one of our Analytics Consultants published Tech Tips, please review this post here: https://community.ptc.com/t5/IoT-Tech-Tips/Anomaly-Detection-concepts-techniques-and-Thingworx-support/m-p/626317
As this is a solutions based concept and topic, I would highly encourage you to speak with your PTC Software Sales rep or Client Success Manager about enablement or solution design assistance if you have additional implementation questions for your deployment of Anomaly Detection.
Regards,
Neel


