
Turn on suggestions
Auto-suggest helps you quickly narrow down your search results by suggesting possible matches as you type.
Showing results for
Turn on suggestions
Auto-suggest helps you quickly narrow down your search results by suggesting possible matches as you type.
Showing results for
Community Tip - You can change your system assigned username to something more personal in your community settings. X
- Community
- ThingWorx
- ThingWorx Developers
- Re: Gantt Chart error as "TypeError: Cannot read p...
Options
- Subscribe to RSS Feed
- Mark Topic as New
- Mark Topic as Read
- Float this Topic for Current User
- Bookmark
- Subscribe
- Mute
- Printer Friendly Page
Gantt Chart error as "TypeError: Cannot read property 'ActualDataRows' of undefined"
Nov 01, 2018
03:16 AM
- Mark as New
- Bookmark
- Subscribe
- Mute
- Subscribe to RSS Feed
- Permalink
- Notify Moderator
Nov 01, 2018
03:16 AM
Gantt Chart error as "TypeError: Cannot read property 'ActualDataRows' of undefined"
Hello,
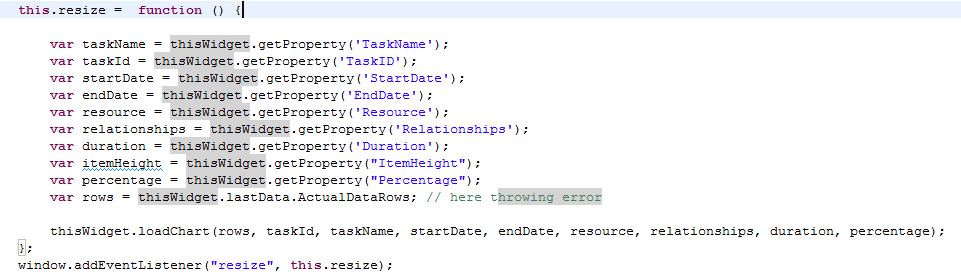
I am using Gantt Chart extension from PTC Marketplace. When I configured and run the mashup it's giving error as "TypeError: Cannot read property 'ActualDataRows' of undefined at resize". (Please refer the below code and the attached image file)
Could you please help me for the same as I am working on the custom widget and following the same code as Gantt Chart extension from PTC Marketplace.
Thanks.
(function () {

	TW.Runtime.Widgets.ganttChart = function () {
        var thisWidget = this;
		var currentlySelectedRow = undefined;

		this.runtimeProperties = function () {
			return {
				'needsDataLoadingAndError': true,
				'supportsAutoResize': true,
			'propertyAttributes': {
				}
			};
		};

		this.renderHtml = function () {
		if (this.properties.ResponsiveLayout === true ) {
			widgetWidth = '100%';
			widgetHeight = '100%';
		} else {
			widgetWidth = this.getProperty("Width");
			widgetHeight = this.getProperty("Height");
		}
			var html = '<div class="widget-content widget-ganttChart"><div id = "chart_div" width=' + widgetWidth + ' height=' + widgetHeight + '> </div></div>';
			return html;
		};


		this.loadChart = function (rows, taskId, taskName, startDate, endDate, resource, relationships, duration, percentage) {
			 google.charts.load('current', {'packages':['gantt']});
			 google.charts.setOnLoadCallback(drawChart);

			 function drawChart() {
			var data = new google.visualization.DataTable();
			 data.addColumn('string', 'Task ID');
			 data.addColumn('string', 'Task Name');
			 data.addColumn('string', 'Resource');
			 data.addColumn('date', 'Start Date');
			 data.addColumn('date', 'End Date');
			 data.addColumn('number', 'Duration');
			 data.addColumn('number', 'Percent Complete');
			 data.addColumn('string', 'Dependencies');

		     var trackStyle = TW.getStyleFromStyleDefinition(thisWidget.getProperty('TrackStyle', 'DefaultGanttTrackStyle'));
			 var altTrackStyle = TW.getStyleFromStyleDefinition(thisWidget.getProperty('AlternativeTrackStyle', 'DefaultAlternativeGanttTrackStyle'));
			 var arrowStyle = TW.getStyleFromStyleDefinition(thisWidget.getProperty('ArrowStyle', 'DefaultGanttArrowStyle'));

			 var trackFill = trackStyle.backgroundColor;
			 var altTrackFill = altTrackStyle.backgroundColor;
			 var arrowColor = arrowStyle.lineColor;
			 var arrowWidth = arrowStyle.lineThickness;

			 for (var i = 0; i < rows.length; i++) {
				 var row = rows[i];

				  data.addRows([
					[row[taskId], row[taskName], row[resource],
					new Date(row[startDate]), new Date(row[endDate]), row[duration], row[percentage], row[relationships]]
				  ]);
			 }
			 var barHeight = thisWidget.getProperty('ItemHeight');
			 var chartHeight = rows.length *  barHeight + 50;
			 var itemHeight = barHeight - 5;
			 var cornerRadius = thisWidget.getProperty('BarCornerRadius');
			 var percentEnabled = thisWidget.getProperty('ShowPercentCompletion');
			 var arrowRadius = thisWidget.getProperty('ArrowRadius');
			 var arrowAngle = thisWidget.getProperty('ArrowAngle');
			  var options = {
				  width: "100%",
				  height: chartHeight,
				  gantt: {
				       barHeight: itemHeight,
					   trackHeight: barHeight,
					   barCornerRadius: cornerRadius,
					   arrow: { angle:arrowAngle, length: 5, spaceAfter: 5, radius: arrowRadius, color: arrowColor, width: arrowWidth},
					   innerGridTrack: {fill: trackFill },
					   innerGridDarkTrack: {fill: altTrackFill},
                       percentEnabled : percentEnabled
					}
				};

				var chart = new google.visualization.Gantt(document.getElementById('chart_div'));

				chart.draw(data, options);

				google.visualization.events.addListener(chart, 'select', function(e) {
					var selection = chart.getSelection();
					if (selection[0] != undefined && selection[0] != null)
						thisWidget.handleRowSelection (selection[0].row);
				});

			 }
		};

		this.afterRender = function () { };


		this.handleSelectionUpdate = function (propertyName, selectedRows, selectedRowIndices) {
			var domElementId = this.jqElementId;
			var widgetElement = this.jqElement;
			var widgetProperties = this.properties;

			if (propertyName == "Data") {
				var widgetProperties = this.properties;

				var idField = widgetProperties['TaskID'];

				thisWidget.ignoreSelectionEvent = true;

				var nSelectedRows = selectedRows.length;

				if (nSelectedRows > 0) {
					for (var x = 0; x < nSelectedRows; x++) {
						if (selectedRows[x]._isSelected === true) {
							thisWidget.handleRowSelection(selectedRows[x]["_row_"]);
							thisWidget.ignoreSelectionEvent = false;
							break;
						}
					}
				} else
					thisWidget.handleRowSelection(undefined);

				thisWidget.ignoreSelectionEvent = false;
			}

		};

		this.handleRowSelection = function (selectedRowNo) {
			if (selectedRowNo !== undefined) {
				var selectedRows = [selectedRowNo];

				if (!thisWidget.ignoreSelectionEvent) {
					thisWidget.updateSelection('Data', selectedRows);
				}
			}

			thisWidget.currentlySelectedRow = selectedRowNo;
		};

	  this.handleItemClick = function (d) {
			thisWidget.handleRowSelection(d["_row_"]);
		};

	  this.assignRowNumbers = function (rows) {
			var rowid;

			for (rowid in rows) {
				var row = rows[rowid];
				row["_row_"] = rowid;
			}
		};

		this.updateProperty = function (updatePropertyInfo) {
			var widgetProperties = this.properties;

			if (updatePropertyInfo.TargetProperty === "Data") {
				thisWidget.lastData = updatePropertyInfo;

				var rows = updatePropertyInfo.ActualDataRows;

				this.assignRowNumbers(rows);

				var taskName = widgetProperties['TaskName'];
				var taskId = widgetProperties['TaskID'];
				var startDate = widgetProperties['StartDate'];
				var endDate = widgetProperties['EndDate'];
				var resource = widgetProperties['Resource'];
				var relationships = widgetProperties['Relationships'];
				var duration = widgetProperties['Duration'];
				var percentage = widgetProperties['Percentage'];

				this.loadChart(rows, taskId, taskName, startDate, endDate, resource, relationships, duration, percentage);

				var selectedRowIndices = updatePropertyInfo.SelectedRowIndices;

				if (selectedRowIndices !== undefined) {
					if (selectedRowIndices.length > 0) {
						var selectedRows = new Array();
						selectedRows.push(rows[selectedRowIndices[0]]);
						setTimeout(function () {
							thisWidget.handleSelectionUpdate("Data", selectedRows, selectedRowIndices);
						}, 100);
					} else {
						setTimeout(function () {
							thisWidget.handleSelectionUpdate("Data", [], []);
						}, 100);
					}
				} else {
					setTimeout(function () {
						thisWidget.handleSelectionUpdate("Data", [], []);
					}, 100);
				}

				if (this.SelectedValuePending !== undefined) {
					this.selectItem(this.SelectedValuePending);
					this.SelectedValuePending = undefined;
				}

			} else if (updatePropertyInfo.TargetProperty === "SelectedValue") {
				var selectedItem = updatePropertyInfo.SinglePropertyValue;

				var dataPropertyInfo = thisWidget.lastData;

				if (dataPropertyInfo != undefined) {
					this.selectItem(selectedItem);
				} else {
					this.SelectedValuePending = selectedItem;
				}
			}
		};

		this.beforeDestroy = function () {

		};
		this.resize =  function () {

			var taskName = thisWidget.getProperty('TaskName');
			var taskId = thisWidget.getProperty('TaskID');
			var startDate = thisWidget.getProperty('StartDate');
			var endDate = thisWidget.getProperty('EndDate');
			var resource = thisWidget.getProperty('Resource');
			var relationships = thisWidget.getProperty('Relationships');
			var duration = thisWidget.getProperty('Duration');
		    var itemHeight = thisWidget.getProperty("ItemHeight");
			var percentage = thisWidget.getProperty("Percentage");

		    var rows = thisWidget.lastData.ActualDataRows; //here throwing error

			thisWidget.loadChart(rows, taskId, taskName, startDate, endDate, resource, relationships, duration, percentage);
		};
		window.addEventListener("resize", this.resize);
	};
}
	());
Solved! Go to Solution.
Labels:
- Labels:
-
Design
-
Mashup-Widget
1 ACCEPTED SOLUTION
Accepted Solutions
Dec 11, 2018
04:31 AM
- Mark as New
- Bookmark
- Subscribe
- Mute
- Subscribe to RSS Feed
- Permalink
- Notify Moderator
Dec 11, 2018
04:31 AM
I have figured out this issue, this error caused because data service not having a triggering event.
Thanks.
4 REPLIES 4
Nov 01, 2018
03:30 AM
- Mark as New
- Bookmark
- Subscribe
- Mute
- Subscribe to RSS Feed
- Permalink
- Notify Moderator
Nov 01, 2018
03:30 AM
Hello,
Your response is highly appreciated.
Thank you.
Nov 01, 2018
08:28 AM
- Mark as New
- Bookmark
- Subscribe
- Mute
- Subscribe to RSS Feed
- Permalink
- Notify Moderator
Nov 01, 2018
08:28 AM
Hello, is anybody there?
Dec 07, 2018
10:28 AM
- Mark as New
- Bookmark
- Subscribe
- Mute
- Subscribe to RSS Feed
- Permalink
- Notify Moderator
Dec 07, 2018
10:28 AM
Hi @ras.
We apologize that your post failed to receive a response. However, since there were follow-ups posted to the original question, it appeared that it was responded to and was unfortunately overlooked.
If you have found a solution to your issue, we would love for you to post it here for the benefit of others who may be struggling with similar issues. We appreciate your use of the Community.
Regards.
--Sharon
Dec 11, 2018
04:31 AM
- Mark as New
- Bookmark
- Subscribe
- Mute
- Subscribe to RSS Feed
- Permalink
- Notify Moderator
Dec 11, 2018
04:31 AM
I have figured out this issue, this error caused because data service not having a triggering event.
Thanks.

