
Turn on suggestions
Auto-suggest helps you quickly narrow down your search results by suggesting possible matches as you type.
Showing results for
Please log in to access translation
Turn on suggestions
Auto-suggest helps you quickly narrow down your search results by suggesting possible matches as you type.
Showing results for
- Community
- ThingWorx
- ThingWorx Developers
- Interpolating Tables based on Start and End Dates
Translate the entire conversation x
Please log in to access translation
Options
- Subscribe to RSS Feed
- Mark Topic as New
- Mark Topic as Read
- Float this Topic for Current User
- Bookmark
- Subscribe
- Mute
- Printer Friendly Page
Interpolating Tables based on Start and End Dates
Jan 28, 2018
05:04 PM
- Mark as New
- Bookmark
- Subscribe
- Mute
- Subscribe to RSS Feed
- Permalink
- Notify Moderator
Please log in to access translation
Jan 28, 2018
05:04 PM
Interpolating Tables based on Start and End Dates
Hello All,
I need to interpolate 2 tables to create a 3rd one based on their values but I cannot figure out how to do it. I tried to use the interpolate service but it did not work as I need.
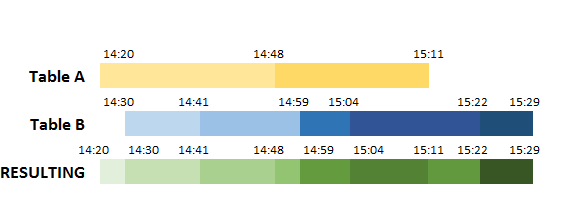
The scenario is that if an event ends before the starts of another happens it creates a new event. Take a look at the scenario:
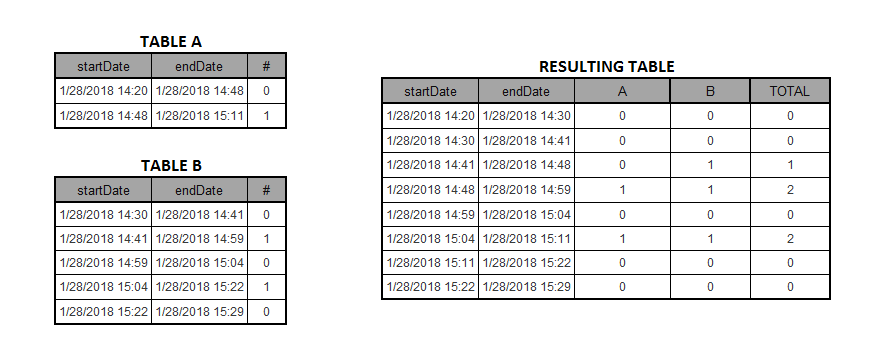
I tried first to create the entire resulting table with the correct start and ends and then I would do the logic to Sum the values, but I was not able to get the
Does anyone have an idea of how to do it?
Cheers
Ewerton
Labels:
- Labels:
-
Troubleshooting
2 REPLIES 2
Jan 29, 2018
03:45 AM
- Mark as New
- Bookmark
- Subscribe
- Mute
- Subscribe to RSS Feed
- Permalink
- Notify Moderator
Please log in to access translation
Jan 29, 2018
03:45 AM
Just iterate over one table, and locate on the other table for matching periods, and at the same time build the resulting table, once done the resulting table, you can build the last column with Derive snippet.
Jan 31, 2018
11:11 AM
- Mark as New
- Bookmark
- Subscribe
- Mute
- Subscribe to RSS Feed
- Permalink
- Notify Moderator
Please log in to access translation
Jan 31, 2018
11:11 AM
Thanks Carles. This was my inital approach but for some reason I did not get it working, so what I did was to create a table with the union of both and the resulting table based on the start date. It almost got the right results, but the final rows did not get processed. So I added them manually.
Ugly, but it worked. It actually showed me that my screenshot was wrong: from 15:11 to 15:22 I had to have 1 and not zero as a result. I have the impression that if I got the logic right I could simplify this a lot:
eventTableA = filterEventTable(eventTable, "A");
eventTableAConsolidated = consolidateRunRateTable(eventTableA, "A")
eventTableB = filterEventTable(eventTable, "B");
eventTableBConsolidated = consolidateRunRateTable(eventTableB, "B")
var params = {
t1: eventTableAConsolidated /* INFOTABLE */,
t2: eventTableBConsolidated /* INFOTABLE */
};
// result: INFOTABLE
var joinedTable = Resources["InfoTableFunctions"].Union(params);
var sort = new Object();
sort.name = "startDate";
sort.ascending = true;
joinedTable.Sort(sort);
var params = {
infoTableName: "InfoTable",
dataShapeName: "CustomAppApp.RunRateChartShape"
};
var result = Resources["InfoTableFunctions"].CreateInfoTableFromDataShape(params);
var currentEndDate = joinedTable[0].endDate;
var newEntry = new Object();
currentEndDate = joinedTable[0].endDate;
for (i = 0; i < joinedTable.length; i++) {
if (joinedTable.startDate < currentEndDate) {
newEntry.startDate = joinedTable.startDate;
i != 0 ? result[result.length - 1].endDate = joinedTable.startDate : null
result.AddRow(newEntry)
} else {
newEntry.startDate = currentEndDate
result[result.length - 1].endDate = currentEndDate
currentEndDate = joinedTable.endDate
result.AddRow(newEntry);
}
}
result.addRow(joinedTable[joinedTable.length - 1])
result[result.length - 2].endDate = result[result.length - 1].startDate
function filterEventTable(table, bocaID) {
var params = {
fieldName: "A_B_Line" /* STRING */,
t: table/* INFOTABLE */,
value: bocaID/* STRING */
};
var eventTable = Resources["InfoTableFunctions"].EQFilter(params);
var sort = new Object();
sort.name = "startDate";
sort.ascending = true;
eventTable.Sort(sort);
return eventTable;
}
for (i = 0; i < eventTableAConsolidated.length; i++) {
for (j = 0; j < result.length; j++) {
if (eventTableAConsolidated.startDate <= result
.startDate && eventTableAConsolidated.endDate >= result .endDate) { logger.warn("RR: " + eventTableAConsolidated.runRate + " I=" + i)
eventTableAConsolidated.runRate ? result
.runRate = parseInt(eventTableAConsolidated.runRate) : result .runRate = 0 }
}
}
for (i = 0; i < eventTableBConsolidated.length; i++) {
for (j = 0; j < result.length; j++) {
if (eventTableBConsolidated.startDate <= result
.startDate && eventTableBConsolidated.endDate >= result .endDate) { if (result
.runRate) { result
.runRate += eventTableBConsolidated.runRate } else {
if (eventTableBConsolidated.runRate) {
result
.runRate = eventTableBConsolidated.runRate } else {
result
.runRate = 0 }
}
}
}
}
function consolidateRunRateTable(table, bocaID) {
var params = { infoTableName: "InfoTable", dataShapeName: "CustomAppApp.RunRateChartShape" };
var eventTableConsolidated = Resources["InfoTableFunctions"].CreateInfoTableFromDataShape(params);
var newEntry = new Object()
var curStatus = 0
for (i = 0; i < table.length; i++) {
if (i == 0) {
curStatus = table.status
newEntry.startDate = table.startDate
}
logger.warn("I: " + i + "TableStatus: " + table.status + " curStatus" + curStatus)
if (table.status != curStatus) {
newEntry.status = table[i - 1].status
newEntry.endDate = table[i - 1].endDate
newEntry.source = table[i - 1].A_B_Line
table[i - 1].status == 2 ? newEntry.runRate = table[i - 1].realRunRate : newEntry.runRate = 0
eventTableConsolidated.AddRow(newEntry);
var curStatus = table.status
newEntry.startDate = table.startDate
}
}
return eventTableConsolidated
}
Carles Coll, thanks for looking into it.


