
Turn on suggestions
Auto-suggest helps you quickly narrow down your search results by suggesting possible matches as you type.
Showing results for
Please log in to access translation
Turn on suggestions
Auto-suggest helps you quickly narrow down your search results by suggesting possible matches as you type.
Showing results for
- Community
- ThingWorx
- ThingWorx Developers
- Re: Regarding TimeSeries Chart
Translate the entire conversation x
Please log in to access translation
Options
- Subscribe to RSS Feed
- Mark Topic as New
- Mark Topic as Read
- Float this Topic for Current User
- Bookmark
- Subscribe
- Mute
- Printer Friendly Page
Regarding TimeSeries Chart
Feb 25, 2020
05:45 AM
- Mark as New
- Bookmark
- Subscribe
- Mute
- Subscribe to RSS Feed
- Permalink
- Notify Moderator
Please log in to access translation
Feb 25, 2020
05:45 AM
Regarding TimeSeries Chart
Hello,
I created new mashup. I am using time series widget. i ca able to view the data in time series chart. But i can't able to get the graph.. Can u please help me to do that? I attached my screenshot below.
Solved! Go to Solution.
Labels:
- Labels:
-
Connectivity
-
Design
ACCEPTED SOLUTION
Accepted Solutions
Feb 25, 2020
05:56 AM
- Mark as New
- Bookmark
- Subscribe
- Mute
- Subscribe to RSS Feed
- Permalink
- Notify Moderator
Please log in to access translation
Feb 25, 2020
05:56 AM
It could be useful to have the mashup and relevant entities, but form the screenshot we see invalid date for the X axis.
This would indicate that either you did not fill XAxisField with a correct field or the datasource has not got any timestamp field, which is required for time series.
Can you clarify how do you get the data from ?
Kind regards
Christophe
17 REPLIES 17
Feb 25, 2020
05:56 AM
- Mark as New
- Bookmark
- Subscribe
- Mute
- Subscribe to RSS Feed
- Permalink
- Notify Moderator
Please log in to access translation
Feb 25, 2020
05:56 AM
It could be useful to have the mashup and relevant entities, but form the screenshot we see invalid date for the X axis.
This would indicate that either you did not fill XAxisField with a correct field or the datasource has not got any timestamp field, which is required for time series.
Can you clarify how do you get the data from ?
Kind regards
Christophe
Feb 26, 2020
12:00 AM
- Mark as New
- Bookmark
- Subscribe
- Mute
- Subscribe to RSS Feed
- Permalink
- Notify Moderator
Please log in to access translation
Feb 26, 2020
12:00 AM
Sometimes in x axis it shows date and time, and in y axis it shows number... if x axis shows date and time means then y axis cant able to show the number it shows NaN and vice versa.
Okay, i will check that one, but why i can't able to see my graph... can you please help me to do that?
Feb 26, 2020
05:23 AM
- Mark as New
- Bookmark
- Subscribe
- Mute
- Subscribe to RSS Feed
- Permalink
- Notify Moderator
Please log in to access translation
Feb 26, 2020
05:23 AM
Hi @DMu3
If you get invalid date or NaN either on x or y, the graph won't be displayed because some input are not understood.
So you need to check the setup of the timeseries chart for the data field and also the correctness of incoming data.
Maybe query incoming values through a different mean (maybe through QueryNumberPropertyHistory service for example) to ensure you get what you expect.
Hope this helps
Christophe
Feb 26, 2020
05:36 AM
- Mark as New
- Bookmark
- Subscribe
- Mute
- Subscribe to RSS Feed
- Permalink
- Notify Moderator
Please log in to access translation
Feb 26, 2020
05:36 AM
Hii,
How to store all the incoming data in thing to datashape. I created value stream also. But data are not storing in datashape. For storing incoming data to shape, what kind of service i should use?
- Tags:
- store
Feb 26, 2020
05:56 AM
- Mark as New
- Bookmark
- Subscribe
- Mute
- Subscribe to RSS Feed
- Permalink
- Notify Moderator
Please log in to access translation
Feb 26, 2020
05:56 AM
Hi @DMu3
Datashape are used to define field of some data. This is then use to format an infotable or datatable for example.
Datashape do not store data themselves.
If you have a property that receives data and you want to store the values, then you can defined the property as logged (in attribute of property), then add a value stream to the Thing.
The data is going to be stored for hat property.
You can query the values using services such as QueryNumberPropertyHistory or QueryStringPropertyHistory ...
Regards
Christophe
Feb 26, 2020
06:04 AM
- Mark as New
- Bookmark
- Subscribe
- Mute
- Subscribe to RSS Feed
- Permalink
- Notify Moderator
Please log in to access translation
Feb 26, 2020
06:04 AM
Hii,
Actually i am getting incoming json data in properties and alerts tab. I used services to get particular value from json. I need to show that data in mashup.. So i created mashup, in that i used time series chart. In mashup, i called that services which i created in thing. If i view mashup means i can't able to see the values.. Current values are displaying but graph is not at all coming.. I attached my Screenshot below..
Feb 26, 2020
06:07 AM
- Mark as New
- Bookmark
- Subscribe
- Mute
- Subscribe to RSS Feed
- Permalink
- Notify Moderator
Please log in to access translation
Feb 26, 2020
06:07 AM
Another Screenshot
- Tags:
- t
Feb 26, 2020
06:59 AM
- Mark as New
- Bookmark
- Subscribe
- Mute
- Subscribe to RSS Feed
- Permalink
- Notify Moderator
Please log in to access translation
Feb 26, 2020
06:59 AM
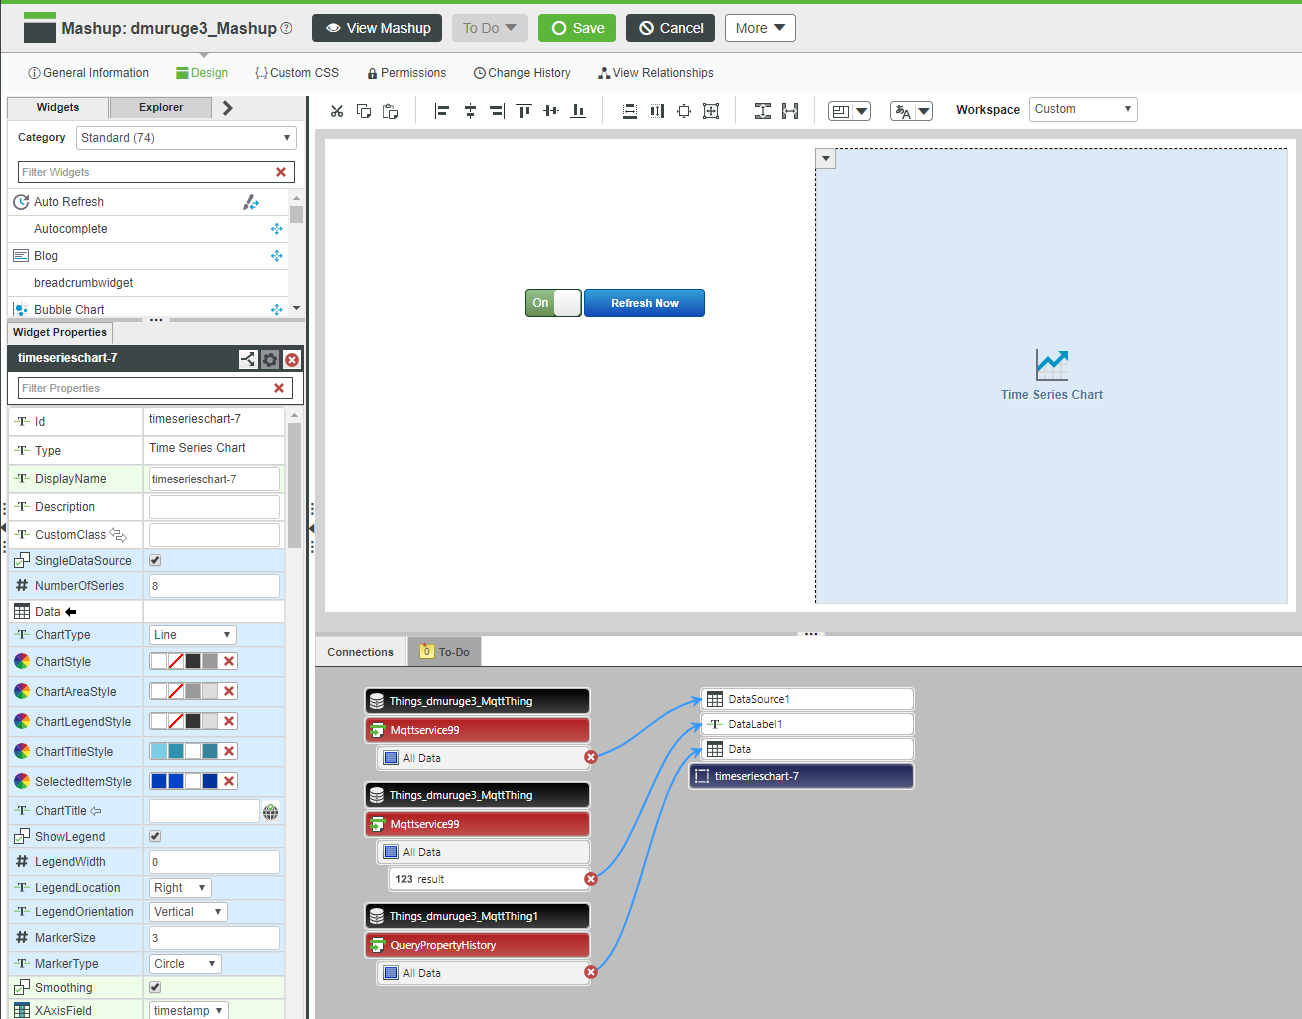
Hi @DMu3
On the mashup there is a configuration issue.
If you bind to the Data field of the tiemseries chart, you should not use the Datasource1, Datasource2 ... and you should set SingleDataSource.
If yo want to have multiple datasource, then bind to Datasource1, datasource2 ... and uncheck SingleDatasource checkbox.
As a troubleshooting step, for a start you can possibly unbound your service and keep only the QueryPropertyHistory service bound to Data as a unique datasource, to chekc you can have your chart ok ... first make sure that QueryPropertyHistory return expected values.
Once this works, you can bind it to Datasource1 instead of Data, and then add your service to Datasource2 and untick SingleDatasource attribute
It might become easier to open a case to Technical Support though.
Regards
Christophe
Feb 26, 2020
07:18 AM
- Mark as New
- Bookmark
- Subscribe
- Mute
- Subscribe to RSS Feed
- Permalink
- Notify Moderator
Please log in to access translation
Feb 26, 2020
07:18 AM
Hello,
In QueryPropertyHistory, i am getting json data, i need to get particular value from json thatswhy i created another service to get particular value. So, which service i should use in mashup?
Feb 26, 2020
07:28 AM
- Mark as New
- Bookmark
- Subscribe
- Mute
- Subscribe to RSS Feed
- Permalink
- Notify Moderator
Please log in to access translation
Feb 26, 2020
07:28 AM
Hi @DMu3
QueryPropertyHistory returns an infotable not a json...so I am a bit confused.
In any case the input to the timeseries chart should have values and timestamp.
So you may need to create a service that collect your input into a infotable with a value field as number and a time field as datetime type.
Regards
Christophe
Feb 27, 2020
03:32 AM
- Mark as New
- Bookmark
- Subscribe
- Mute
- Subscribe to RSS Feed
- Permalink
- Notify Moderator
Please log in to access translation
Feb 27, 2020
03:32 AM
Hii,
In properties and alert tab, am getting only json data. so I created service for getting the particular value from json. okay, in mashup i called that service which i created in thing, i attached my screenshot below.
Feb 27, 2020
03:37 AM
- Mark as New
- Bookmark
- Subscribe
- Mute
- Subscribe to RSS Feed
- Permalink
- Notify Moderator
Please log in to access translation
Feb 27, 2020
03:37 AM
In that screenshot, i can't able to set x axis and y axis but the values are updating automatically, i can't able to see my graph also. please help me to do that.
Feb 27, 2020
11:04 AM
- Mark as New
- Bookmark
- Subscribe
- Mute
- Subscribe to RSS Feed
- Permalink
- Notify Moderator
Please log in to access translation
Feb 27, 2020
11:04 AM
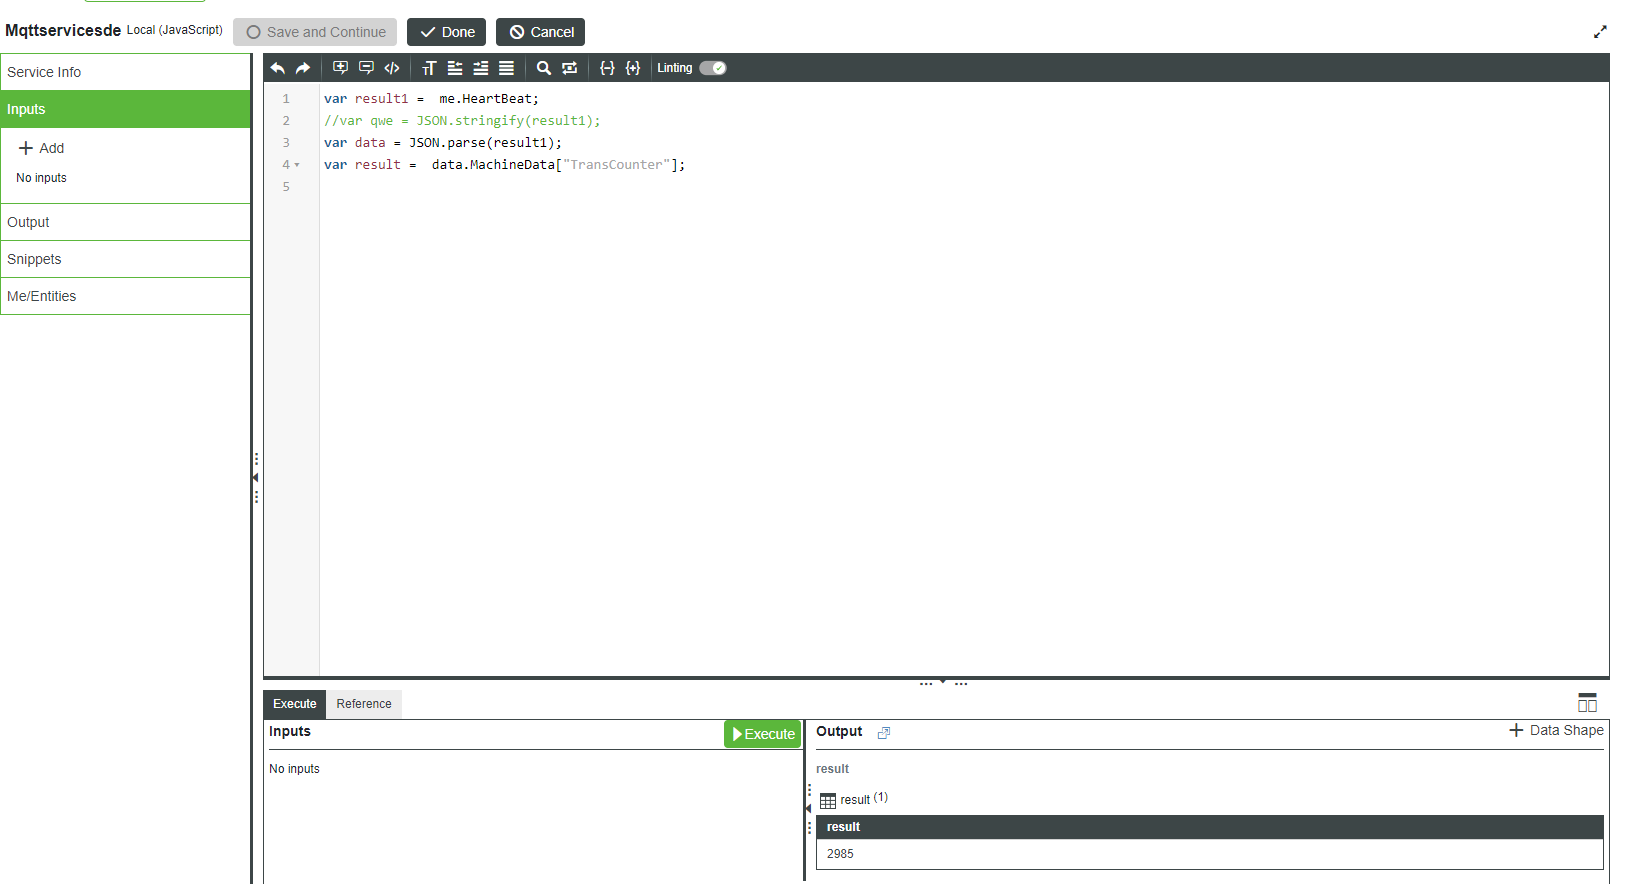
Hi @DMu3
Can you execute the service Mqttservice99 manually from the thing and show what is its output ?
Thanks
Christophe
Feb 27, 2020
11:37 PM
- Mark as New
- Bookmark
- Subscribe
- Mute
- Subscribe to RSS Feed
- Permalink
- Notify Moderator
Please log in to access translation
Feb 28, 2020
04:25 AM
- Mark as New
- Bookmark
- Subscribe
- Mute
- Subscribe to RSS Feed
- Permalink
- Notify Moderator
Please log in to access translation
Feb 28, 2020
04:25 AM
Thank you for this.
So your service is returning one value, this won't work for a timeseries chart.
You do need an output with value and timestamp.
This is why you get invalid date in the chart, because there is not DATETIME property.
So in your service when you build the result variable you need to add also the timestamp of when this value has been received, maybe by parsing it in the json if present in there or making it up, but you do need a timestamp having the type DATETIME.
The other issue I see is that your service is returning only one value, I don't think this will work because the chart needs more than one value to draw line (it might work if you change the chart type to Marker but even then you will ever see only one point because each time the chart will be refreshed).
So if you receive single data each time, one way to make it work would be to create a new property of type info table with a datashape similar to value NUMBER and time DATETIME and have your service add to it each time the it is called and output this as the result.
In that way the info table will keep on growing with the history of the values and the chart will be showing that.
Kind regards
Christophe
Mar 02, 2020
12:08 AM
- Mark as New
- Bookmark
- Subscribe
- Mute
- Subscribe to RSS Feed
- Permalink
- Notify Moderator
Please log in to access translation
Mar 02, 2020
12:08 AM
Thankyou for your reply, Now it works properly..
Mar 02, 2020
03:58 AM
- Mark as New
- Bookmark
- Subscribe
- Mute
- Subscribe to RSS Feed
- Permalink
- Notify Moderator
Please log in to access translation
Mar 02, 2020
03:58 AM
Hi @DMu3
I am pleased that it works for you now.
It would be useful if you could mark the previous reply as correct answer as this will help others with similar issue to find the answer more quickly, especially since there has been quite a few exchanges on this thread.
thank you
kind regards
Christophe


