
Turn on suggestions
Auto-suggest helps you quickly narrow down your search results by suggesting possible matches as you type.
Showing results for
Please log in to access translation
Turn on suggestions
Auto-suggest helps you quickly narrow down your search results by suggesting possible matches as you type.
Showing results for
- Community
- ThingWorx
- ThingWorx Developers
- Re: Time Series Chart can't display values of type...
Translate the entire conversation x
Please log in to access translation
Options
- Subscribe to RSS Feed
- Mark Topic as New
- Mark Topic as Read
- Float this Topic for Current User
- Bookmark
- Subscribe
- Mute
- Printer Friendly Page
Time Series Chart can't display values of type Long
Dec 10, 2018
09:59 AM
- Mark as New
- Bookmark
- Subscribe
- Mute
- Subscribe to RSS Feed
- Permalink
- Notify Moderator
Please log in to access translation
Dec 10, 2018
09:59 AM
Time Series Chart can't display values of type Long
Hi
I'm trying to add an time series chart to my mashup in thingworx with values of type LONG from an OPC UA stream.
The values for that chart are of type LONG and therefore they are not displayed in the chart. Is there a setting where a time series chart could display LONG values?
Is there an elegant way to convert these values by a custom service before sending them to the time series chart?
Thanks
Solved! Go to Solution.
Labels:
- Labels:
-
Coding
-
Design
-
Mashup-Widget
-
Troubleshooting
ACCEPTED SOLUTION
Accepted Solutions
Dec 12, 2018
02:54 AM
- Mark as New
- Bookmark
- Subscribe
- Mute
- Subscribe to RSS Feed
- Permalink
- Notify Moderator
Please log in to access translation
Dec 12, 2018
02:54 AM
Thanks for the project @michaBrunner !
I imported it and it's only displaying the number.
It seems like for the Chart the Properties have not been bound - I'm not sure if that's due to the export or something missing in the original configuration.
Could you please map in the Chart's properties
- XAxisField = timestamp
- DataField1 = TestLong
- DataField2 = TestNumber
This did the trick for me.
I hope it's working for you as well - if not, please let me know...
Cheers,
Michael
5 REPLIES 5
Dec 11, 2018
02:36 AM
- Mark as New
- Bookmark
- Subscribe
- Mute
- Subscribe to RSS Feed
- Permalink
- Notify Moderator
Please log in to access translation
Dec 11, 2018
02:36 AM
Hi,
I've tried the TimeSeries Chart and the TimeSeries Chart version 2 - in ThingWorx 8.3.1.
Both seem to work for me with LONG values coming from a Value Stream.
The biggest number I was trying was 1234567890123456768.
Adding another number e.g. another 9 in the end will not be allowed during the number entry.
What's the number range you're using?
Which ThingWorx version are you on?
Cheers,
Michael
Dec 11, 2018
09:14 AM
- Mark as New
- Bookmark
- Subscribe
- Mute
- Subscribe to RSS Feed
- Permalink
- Notify Moderator
Please log in to access translation
Dec 11, 2018
09:14 AM
Hi Thanks for the reply
I am using ThingWorx 8.3.2-b535. This is strange...
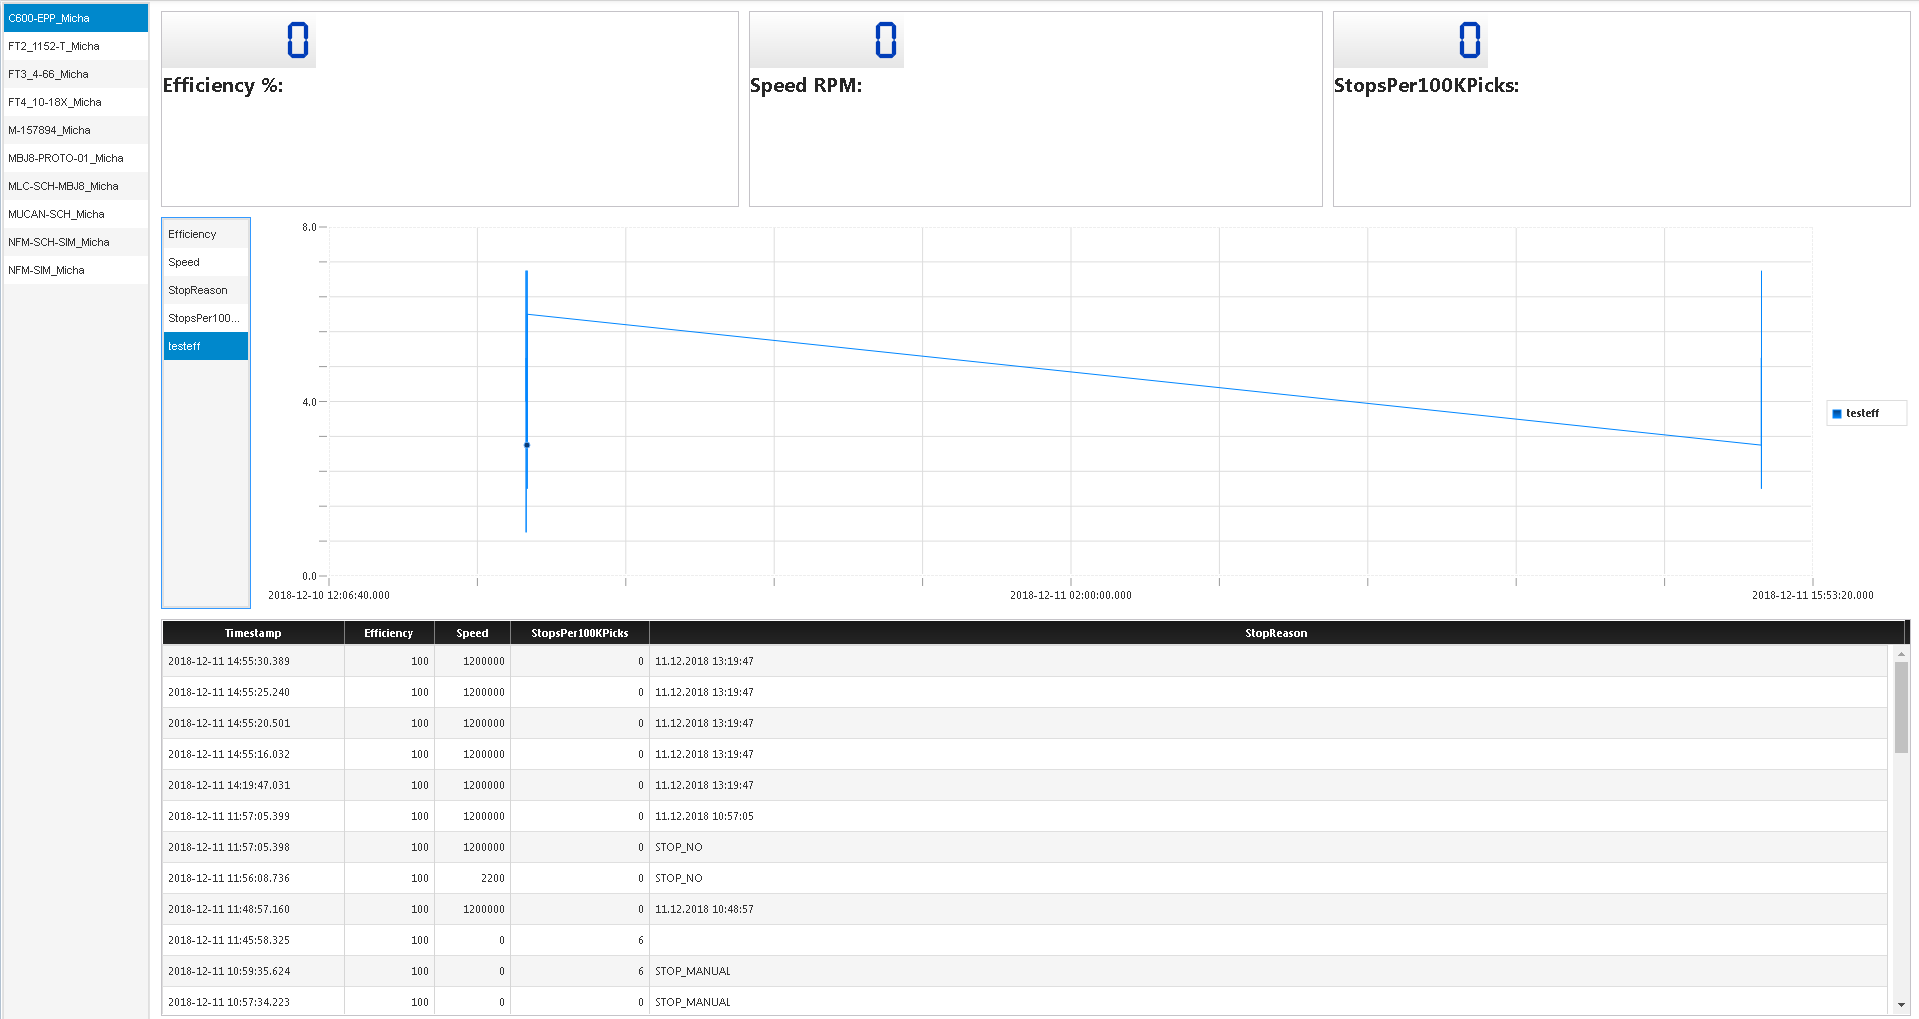
I've attached 3 files of my mashup. I added an additional property to my C600-EPP_Micha Thing which is of Type Number and has the name "testeff". As you can see this property is displayed in the time series chart.
But when I select "Efficiency" which is of type LONG then nothing is displayed. The data seems to load as you can see in the table below the chart. There are a lot of values for Efficiency, Speed and StopsPer100KPicks which are all properties of type LONG. So the query itself must be working.
The 3rd screenshot is showing the configuration of the table. Do you have any Idea how this could happen?
I did the same with a generic thing, which has two properties one is a LONG and one is NUMBER. The NUMBER one is displayed, the Long one not.
Dec 11, 2018
09:23 AM
- Mark as New
- Bookmark
- Subscribe
- Mute
- Subscribe to RSS Feed
- Permalink
- Notify Moderator
Please log in to access translation
Dec 11, 2018
09:23 AM
I created a small example project. In this project only the TestNumber property is displayed in the chart but not the TestLong property
Dec 12, 2018
02:54 AM
- Mark as New
- Bookmark
- Subscribe
- Mute
- Subscribe to RSS Feed
- Permalink
- Notify Moderator
Please log in to access translation
Dec 12, 2018
02:54 AM
Thanks for the project @michaBrunner !
I imported it and it's only displaying the number.
It seems like for the Chart the Properties have not been bound - I'm not sure if that's due to the export or something missing in the original configuration.
Could you please map in the Chart's properties
- XAxisField = timestamp
- DataField1 = TestLong
- DataField2 = TestNumber
This did the trick for me.
I hope it's working for you as well - if not, please let me know...
Cheers,
Michael
Dec 12, 2018
03:17 AM
- Mark as New
- Bookmark
- Subscribe
- Mute
- Subscribe to RSS Feed
- Permalink
- Notify Moderator
Please log in to access translation
Dec 12, 2018
03:17 AM
That solved the problem for me. Thanks a lot.
Maybe there is somthing wrong in the autoconfig method of the time series chart, but with this manual configuration it works perfectly
Thanks again


