- Community
- ThingWorx
- ThingWorx Developers
- Time Series Chart to Export Image ?
- Subscribe to RSS Feed
- Mark Topic as New
- Mark Topic as Read
- Float this Topic for Current User
- Bookmark
- Subscribe
- Mute
- Printer Friendly Page
Time Series Chart to Export Image ?
- Mark as New
- Bookmark
- Subscribe
- Mute
- Subscribe to RSS Feed
- Permalink
- Notify Moderator
Time Series Chart to Export Image ?
Time Series Chart to Export Image ?
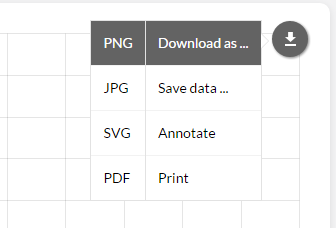
chart How that can add plug in
help me T.T
amExport = {
top : 0,
right : 0,
exportJPG : true,
exportPNG : true,
exportSVG : true
}
// Advanced configuration
amExport.userCFG = {
menuTop : 'auto',
menuLeft : 'auto',
menuRight : '0px',
menuBottom : '0px',
menuItems : [{
textAlign : 'center',
icon : '../amcharts/images/export.png',
iconTitle : 'Save chart as an image',
onclick : function () {},
items : [{
title: 'JPG',
format: 'jpg'
}, {
title: 'PNG',
format: 'png'
}, {
title: 'SVG',
format: 'svg'
}]
}],
menuItemStyle: {
backgroundColor : 'transparent',
opacity : 1,
rollOverBackgroundColor : '#EFEFEF',
color : '#000000',
rollOverColor : '#CC0000',
paddingTop : '6px',
paddingRight : '6px',
paddingBottom : '6px',
paddingLeft : '6px',
marginTop : '0px',
marginRight : '0px',
marginBottom : '0px',
marginLeft : '0px',
textAlign : 'left',
textDecoration : 'none',
fontFamily : 'Arial', // Default: charts default
fontSize : '12px', // Default: charts default
},
menuItemOutput: {
backgroundColor : '#FFFFFF',
fileName : 'amCharts',
format : 'png',
output : 'dataurlnewwindow',
render : 'browser',
dpi : 90,
onclick : function(instance, config, event) {
event.preventDefault();
instance.output(config);
}
},
legendPosition: "bottom", //top,left,right
removeImagery: true
}
- Labels:
-
Extensions
- Mark as New
- Bookmark
- Subscribe
- Mute
- Subscribe to RSS Feed
- Permalink
- Notify Moderator
There is no built in structure in Thingworx to do this. Even using some html parsing will likely not work because of how the chart is rendered. The simplest and current way is to do a screen capture.


