- Community
- ThingWorx
- ThingWorx Developers
- Re: Timeseries chart problem using value stream.
- Subscribe to RSS Feed
- Mark Topic as New
- Mark Topic as Read
- Float this Topic for Current User
- Bookmark
- Subscribe
- Mute
- Printer Friendly Page
Timeseries chart problem using value stream.
- Mark as New
- Bookmark
- Subscribe
- Mute
- Subscribe to RSS Feed
- Permalink
- Notify Moderator
Timeseries chart problem using value stream.
Dear Team,
I need to show time series chart using value stream. I have total 8 assets(things). In which some asset has same value and other one has random value.
As I have seen those asset has same value no value is logged.
As my asset2 has same value so graph will like.

For asset1 has random value so graph will like

SO what is problem in case of asset2. Is logged property value is not get stored due to same value?
- Mark as New
- Bookmark
- Subscribe
- Mute
- Subscribe to RSS Feed
- Permalink
- Notify Moderator
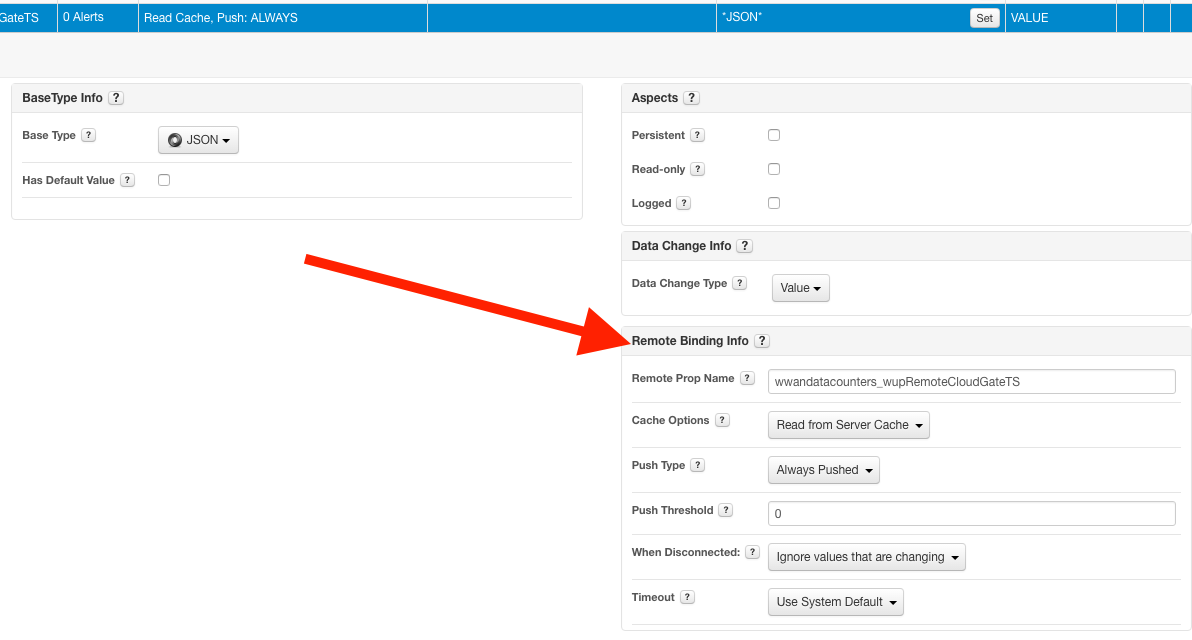
If you wan't to record value changes whenever you receive a data point, still if it are exactly the same value, you need to set property "Data Change Info" to Always ( on Composer editing properties ). This is for the property itself, but if it's remote binded you may need to ensure that you are receiving Values always, you may need to tweak propertie's "Remote Binding Info" settings.
Best Regards,
Carles.
- Mark as New
- Bookmark
- Subscribe
- Mute
- Subscribe to RSS Feed
- Permalink
- Notify Moderator
Thanks Carles,
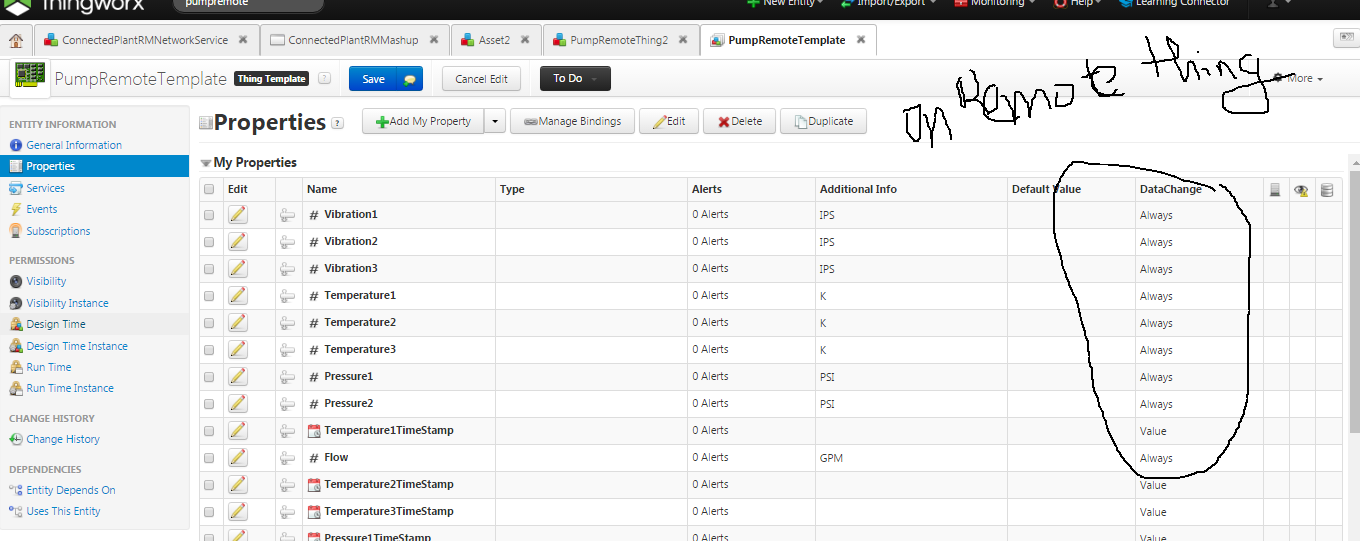
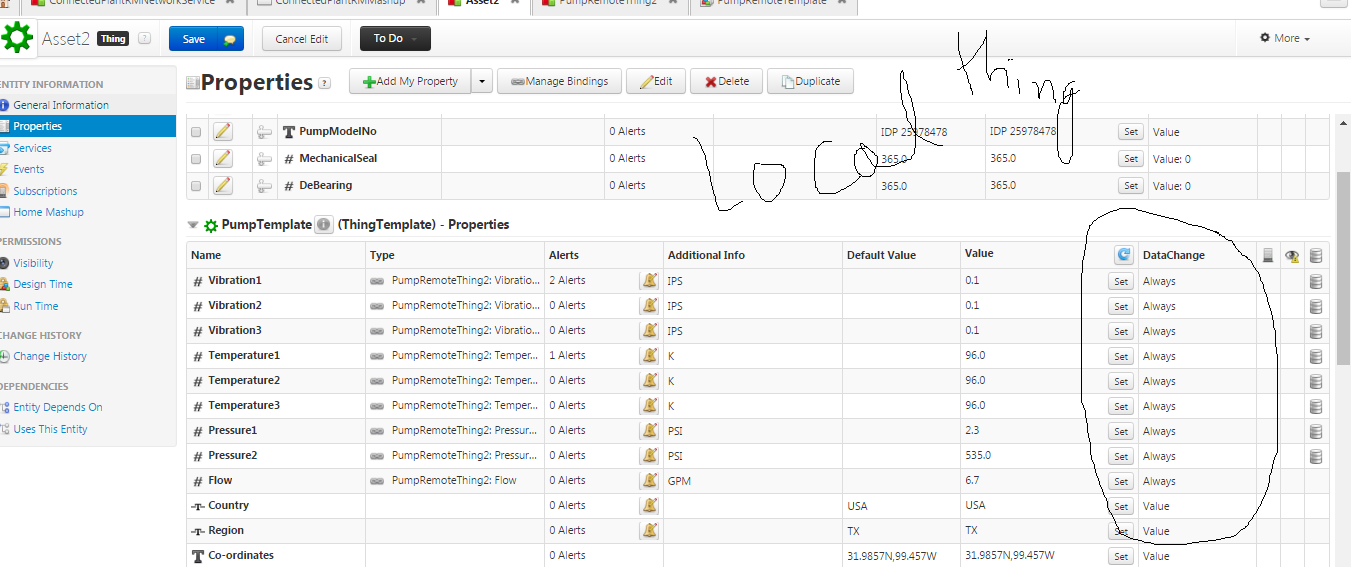
As u mentioned said changes has done in thing (set property "Data Change Info" to Always ( on Composer editing properties )). Also same changes has done in remotething. But still no changes on chart.
- Mark as New
- Bookmark
- Subscribe
- Mute
- Subscribe to RSS Feed
- Permalink
- Notify Moderator
This will only apply for new data, old data it's already "lost".
- Mark as New
- Bookmark
- Subscribe
- Mute
- Subscribe to RSS Feed
- Permalink
- Notify Moderator
Data is continuously coming from simulator server only data is same.
- Mark as New
- Bookmark
- Subscribe
- Mute
- Subscribe to RSS Feed
- Permalink
- Notify Moderator
- Mark as New
- Bookmark
- Subscribe
- Mute
- Subscribe to RSS Feed
- Permalink
- Notify Moderator
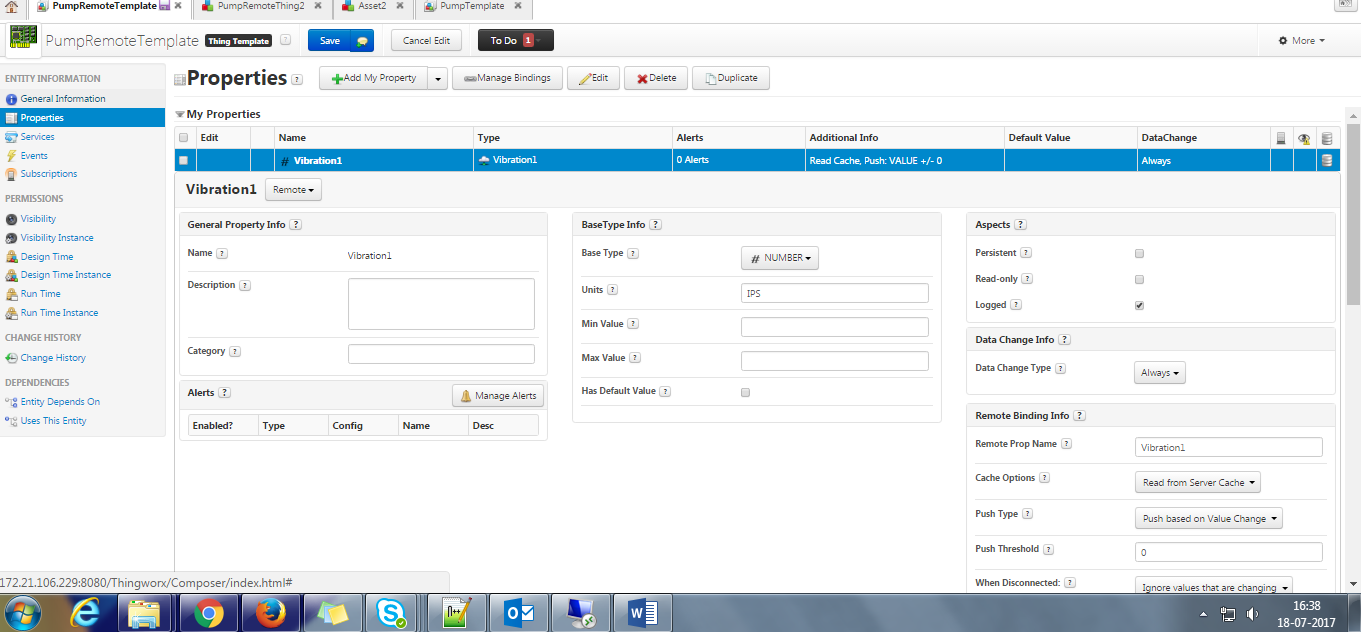
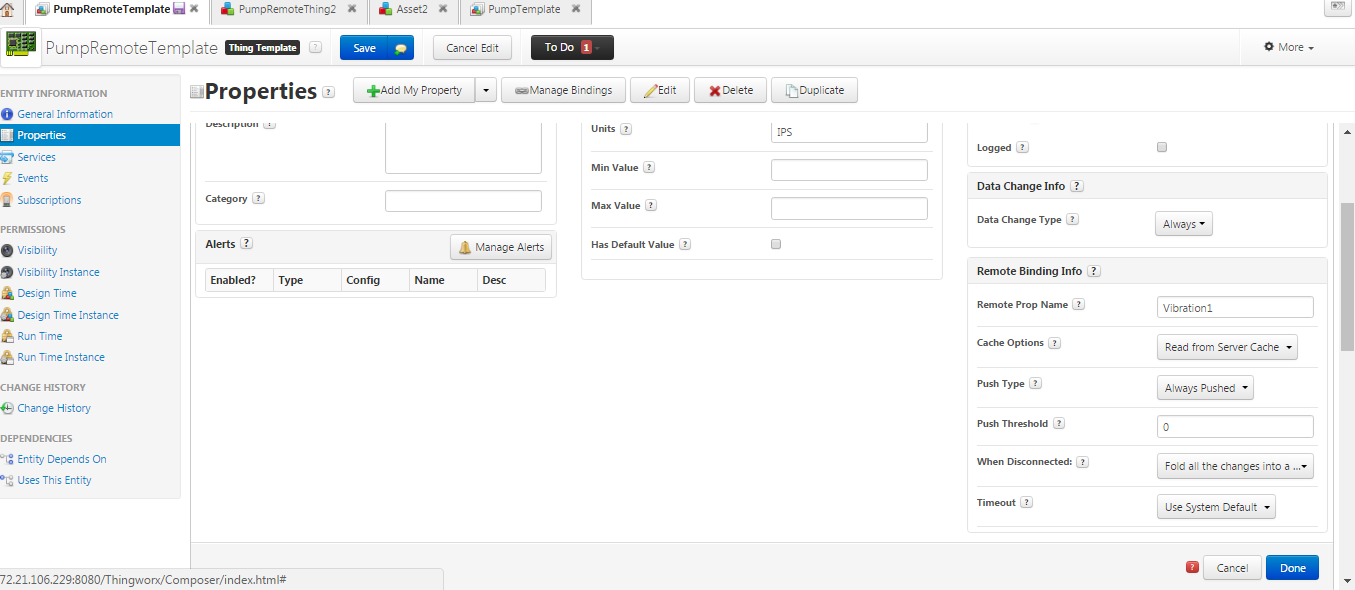
When I mean remote property binding info, I mean this section :
- Mark as New
- Bookmark
- Subscribe
- Mute
- Subscribe to RSS Feed
- Permalink
- Notify Moderator
Thanks Carles,
Shown image is part of which entities?. As I am using Thingworx 7.3.1
- Mark as New
- Bookmark
- Subscribe
- Mute
- Subscribe to RSS Feed
- Permalink
- Notify Moderator
Should be on Remote Thing Propertie's
- Mark as New
- Bookmark
- Subscribe
- Mute
- Subscribe to RSS Feed
- Permalink
- Notify Moderator
In Thingworx 7.3.1 no such option are in RemoteThing properties
- Mark as New
- Bookmark
- Subscribe
- Mute
- Subscribe to RSS Feed
- Permalink
- Notify Moderator
Then Properties aren't remote, are Local Properties on a Remote Thing
- Mark as New
- Bookmark
- Subscribe
- Mute
- Subscribe to RSS Feed
- Permalink
- Notify Moderator
Thanks for clarification,
As said , I have changed all property as remote bound. But still data is not get logged.
- Mark as New
- Bookmark
- Subscribe
- Mute
- Subscribe to RSS Feed
- Permalink
- Notify Moderator
Please ignore previous image
- Mark as New
- Bookmark
- Subscribe
- Mute
- Subscribe to RSS Feed
- Permalink
- Notify Moderator
It seems everything it's ok now on TW side
But I don't know if you remote Thing really sends data when it's different... You will need to debug the remote side ( EDGE part ) to know if you are sending values when it are equal.
If you want to check from TW Side, you can activate Application Log to "Info" level and there you will see coming remote messages data.
Carles.
- Mark as New
- Bookmark
- Subscribe
- Mute
- Subscribe to RSS Feed
- Permalink
- Notify Moderator
Hi Carles,
As I said from edge value are same for this things rest thing has random value. In case if edge sending same value then chart should show straight line. But here values are not logged. and no line on chart.
- Mark as New
- Bookmark
- Subscribe
- Mute
- Subscribe to RSS Feed
- Permalink
- Notify Moderator
I'm sorry, but I don't get the whole picture.
But anyway, if you don't have data points when value it's the same, then it's just a visualization problem, for which as far as I know Standard TW Widgets doesn't provides a way to draw a rect with the previous value ( or with the next value ), it always interpolates between two contiguous datapoints. We had to customize the Standard Timeseries graph widget in order to do this.
Another solution could be if you create "fake" datapoints on Server Side, for instance lets say you have the following data:
Timestamp Value
2017/06/18 17:00:00.000 10
2017/06/18 17:24:00.000 14
2017/06/18 18:13:00.000 13
To generate Right Rects on the TimeSeries graph, you may build a service which returns:
Timestamp Value
2017/06/18 17:00:00.000 10
2017/06/18 17:23:59.999 10 (fake DataPoint)
2017/06/18 17:24:00.999 14
2017/06/18 18:12:59.999 14 (fake DataPoint)
2017/06/18 18:13:00.999 13
The previous datapoints will generate the graph you want to see.
- Mark as New
- Bookmark
- Subscribe
- Mute
- Subscribe to RSS Feed
- Permalink
- Notify Moderator
Thanks Carles,
If value are changing values are get stored and graph is showing. But if same value continuosly coming then no value get logged and hence no chart .
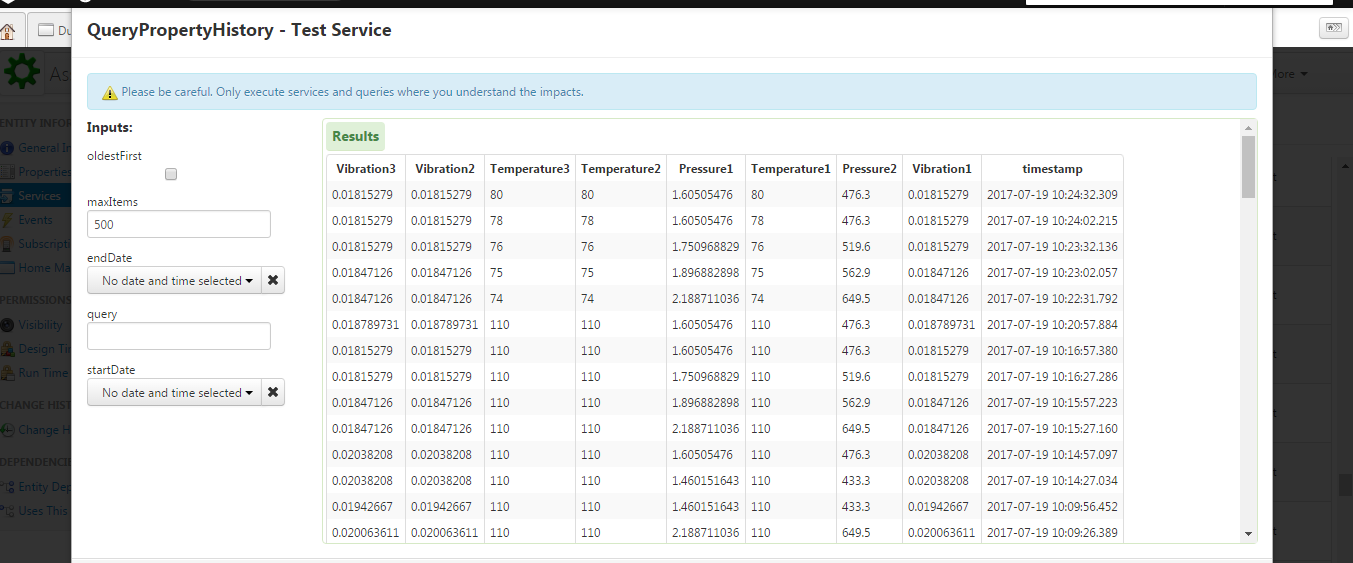
Below image for asset2 whose same value coming from edge so it unable to store value.

Below image for asset1 whose different values coming from edge so its able to store value and chart is visible
